| Kaufman Development Insights | October 2025
The Geography of Income in America
Across the United States, household income tells a story about more than just wages — it reflects the broader geography of opportunity, cost of living, and industry mix that defines each region.
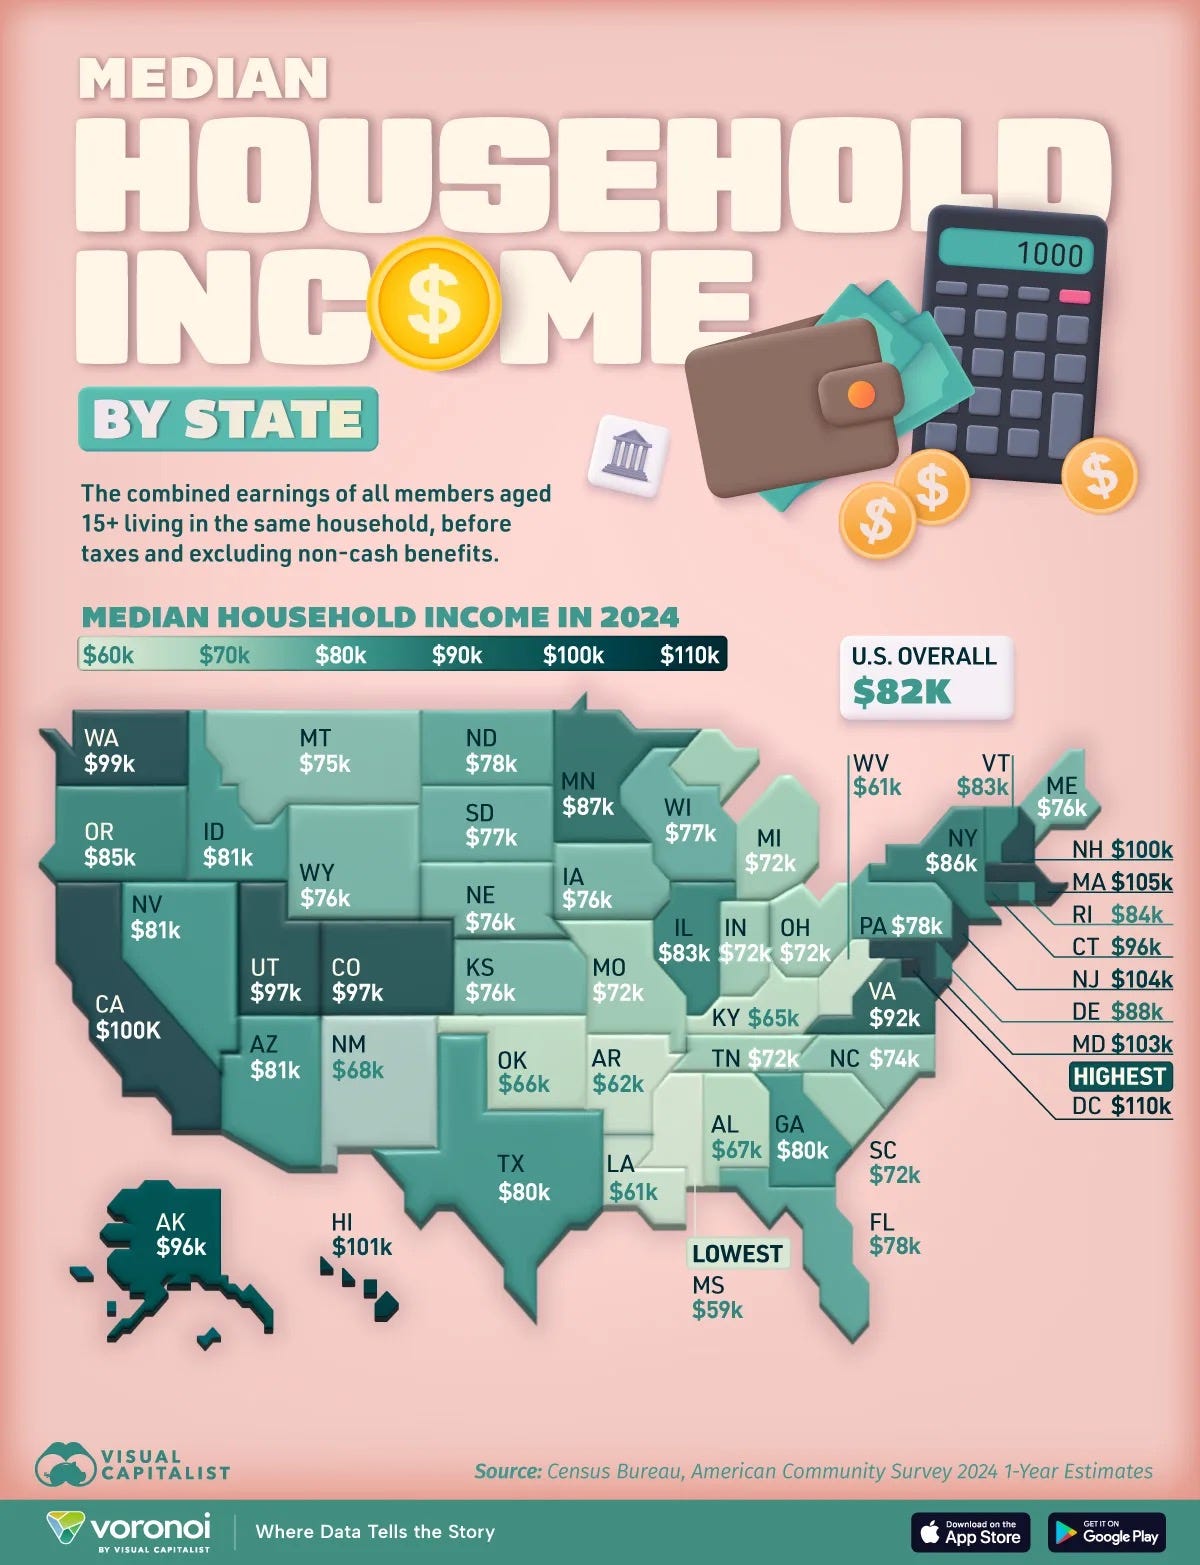
New data from the U.S. Census Bureau’s American Community Survey (2024) puts those disparities into focus. Median household income ranged from $59,000 in Mississippi to nearly $110,000 in Washington D.C. — a gap of over $50,000 between the top and bottom of the spectrum.
The National Picture
The median U.S. household income stood at $81,604 in 2024. But the distribution is far from uniform:
Top five states (plus D.C.): Massachusetts, New Jersey, Maryland, Hawaii, and California — all with median household incomes above $100,000, more than 20% higher than the national median.
Lowest five: Mississippi, West Virginia, Louisiana, Arkansas, and Kentucky — all with household incomes under $65,000.
This divide reveals the structural economic differences that shape housing markets, wage growth, and consumer demand at the local level.
High-Earning States Cluster Along the Coasts
The coasts — both East and West — continue to dominate in household income.
Technology, finance, healthcare, and government employment drive much of that strength. States like California ($100K), Massachusetts ($105K), and Maryland ($103K) benefit from deep, high-skill labor markets that support both professional services and innovation economies.
Even Hawaii ($101K), with its unique cost structure and tourism-heavy economy, cracks the top five — a reminder that local income often correlates closely with the cost of living.
Among inland states, Colorado ($97K) and Utah ($97K) stand out as outliers. Both have diversified economies and have seen massive in-migration from higher-cost states, pushing wages upward and housing markets into new territory.
Southern States Continue to Lag — But Context Matters
At the other end of the spectrum, Southern states remain well below the national median:
-
Mississippi: $59K
-
West Virginia: $61K
-
Louisiana: $61K
-
Arkansas: $62K
-
Kentucky: $65K
While these figures trail the national average by up to 30%, they also align with much lower housing costs, particularly for single-family homes. For real estate investors, that distinction is crucial. Lower nominal incomes don’t always translate to weaker purchasing power — especially in markets with affordable land, favorable taxes, and rising in-migration.
That’s part of why investors are quietly expanding into Southern metros: the combination of below-median incomes and below-replacement housing stock creates long-term opportunity as affordability pressures push renters and buyers away from coastal markets.
Takeaway for Developers and Investors
Income distribution isn’t just an economic data point — it’s a map of where demand, affordability, and capital flows will move next.
High-income coastal states may capture more GDP and institutional capital, but mid-tier and lower-income regions are now where growth, yield, and migration are converging.
As developers, that means thinking beyond wage levels and focusing instead on income-to-cost ratios, migration trends, and local job diversification — the real indicators of sustainable market health.
For more data-driven insights on housing, migration, and market dynamics, subscribe to my Substack.