The data points to some surprising cities — and a few you’d expect
A lot has shifted in the multifamily investment landscape over the past few years. Cap rates have climbed. Inventory has loosened up in many markets. Pricing pressure, while still real in some places, has eased enough that buyers finally have room to slow down and think rather than rush into deals.
So where does the data actually point right now?
LoopNet recently ranked 50 U.S. cities based on a combination of financial metrics — cap rates, listing prices, property tax rates, unit counts, square footage — alongside lifestyle indicators like park access and restaurant density, which are meaningful proxies for long-term renter demand. I found the methodology thoughtful enough to be worth breaking down, and the results surfaced a few markets I think deserve a closer look.
The Top Five Overall
Washington, D.C. claimed the top spot with a composite score of 100. It’s not just the 7.04% cap rate or the low 0.58% property tax rate that stands out — it’s the combination. Nearly every resident lives within a 10-minute walk of a park, and the city leads the entire 50-city index for James Beard Award winners and nominees per capita. That kind of livability doesn’t just make for great neighborhoods — it makes for stable, long-term tenants.
Las Vegas ranked second. The average listing price sits around $2 million, but properties here are large — averaging nearly 79,000 square feet per listing and over 60 units per property. Paired with a 7.07% cap rate and one of the lowest property tax rates in the study (0.50%), the scale economics can work in your favor.
Denver came in third, and honestly, the 0.44% property tax rate is hard to ignore — the second-lowest in the entire study. The cap rate of 5.82% is more modest, but with 7.55% of listings classified as Class A and strong park access for residents, Denver tends to attract the kind of stable tenant base that makes long-term holds easier.
Miami at number four had the highest number of multifamily listings per 10,000 residents of any city in the index. That kind of inventory depth matters when you’re sourcing deals. Large properties, a 6.26% cap rate, and a lifestyle profile that continues to draw migration make it a market worth watching.
Richmond, Virginia rounded out the top five — and this one is worth paying attention to if you’ve been sleeping on secondary East Coast markets. A 7.25% cap rate, a 0.55% property tax rate, and properties averaging 45 units per building create a reasonable entry point with solid yield potential.
The High-Yield Tier
If your primary focus is cash flow, a different set of cities rises to the top.
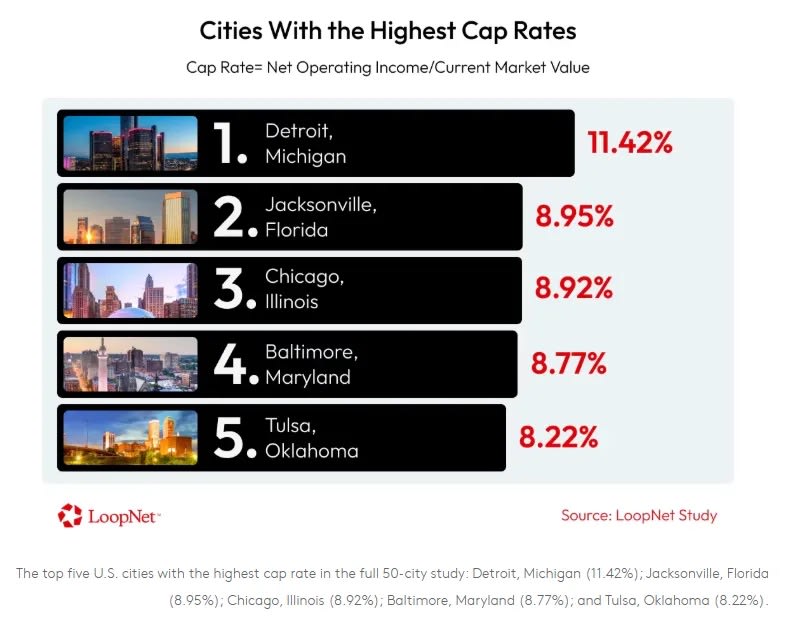
Detroit leads the entire study with an 11.42% cap rate. Entry prices are accessible — the average listing price is under $1.5 million — and 84% of residents have walkable park access. The property tax rate of 1.64% is the highest in this group, which is worth factoring into your underwriting, but the income potential at that cap rate is hard to ignore for investors comfortable with the market.
Jacksonville (8.95%), Chicago (8.92%), Baltimore (8.77%), and Tulsa (8.22%) round out the high-yield tier. Baltimore in particular caught my eye — it pairs that 8.77% cap rate with one of the lowest average listing prices in the entire study at just over $1 million, and properties there average 55 units per listing. That combination of yield and accessible pricing is relatively rare.
What the Methodology Gets Right
I appreciate that LoopNet didn’t just rank on cap rate alone. Chasing yield without understanding the underlying market fundamentals is how investors end up with high-returning assets in neighborhoods where nobody wants to live. The lifestyle indicators in this study — park quality and access, restaurant density, playgrounds per capita — aren’t soft metrics. They’re demand signals. Tenants choose neighborhoods, not just apartments, and markets that offer genuine livability tend to hold occupancy better through economic cycles.
The weighting places 76% on financial and inventory metrics (cap rate, tax rates, listing density, unit counts, price per square foot, class composition) and 24% on lifestyle indicators. That feels about right.
A Few Things Worth Keeping in Mind
No ranking methodology is a substitute for boots-on-the-ground due diligence. Average cap rates across a city can obscure enormous variation at the submarket and asset level. A city with an 8% average cap rate will still have plenty of deals that don’t pencil, and a city with a 5.5% average can still surface exceptional opportunities if you know where to look.
What data like this does well is help you prioritize where to focus your attention. If you’re evaluating five markets and trying to decide which ones justify the time and travel for deeper research, a study like this one gives you a reasonable place to start the conversation.
The broader context also matters: this is still a market where discipline wins. More inventory and less pricing pressure than a few years ago means there are real opportunities out there — but it also means there are more deals that look better on the surface than they are underneath. Underwriting carefully, understanding your local tax implications, and thinking hard about who your tenant base will be in five to ten years are all as important as ever.
The full LoopNet ranking covers all 50 cities and includes data on listing prices, cap rates, unit counts, square footage, property tax rates, and lifestyle metrics. If you’re actively evaluating markets right now, it’s worth a read.
As always, happy to talk through any of these markets in more detail.
Daniel Kaufman is a real estate developer focused on community-driven residential and commercial projects. You can learn more at danielkaufmanre.com