
Bessent made his case on wages. Bank of America has after-tax pay for lower-income households up 5.2% year over year in July, ahead of the 4.2% gain for higher earners. PNC has the spending gap between its highest and lowest income customers down to 0.1 percentage point. On paper, that is convergence.
I do not underwrite paper. I underwrite behavior. And the behavior in housing, on the for-sale side and on the rental side, still splits cleanly down the middle.
The For-Sale Market: Buyers Are Quitting Before They Ever Call an Agent
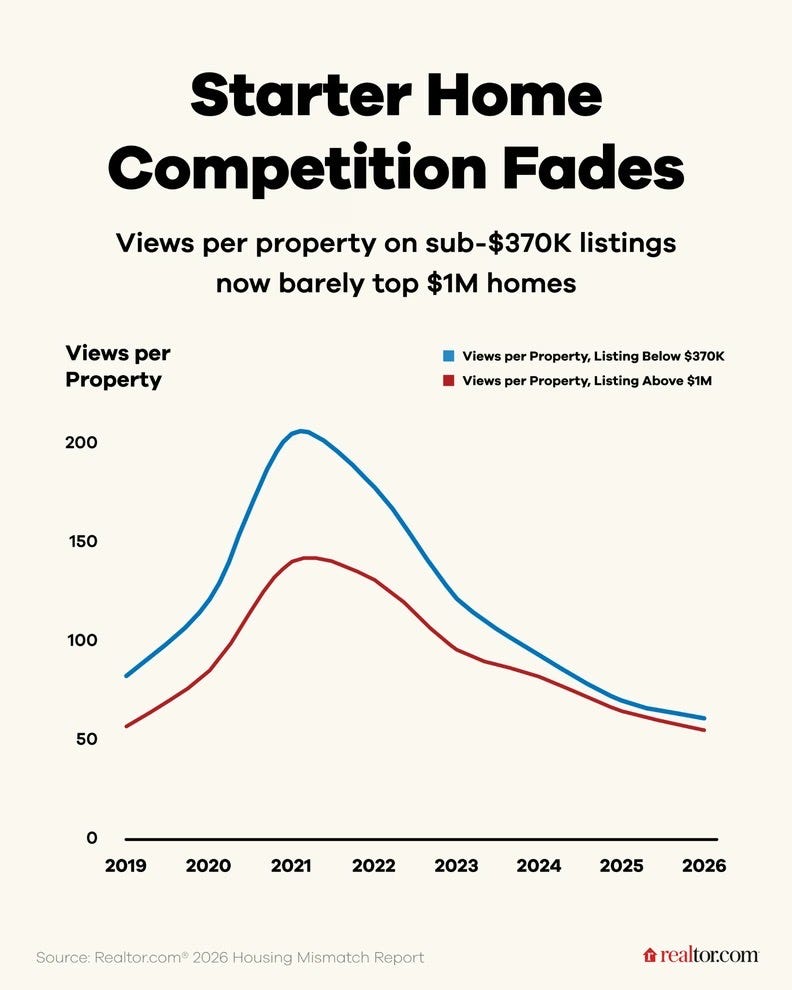
Realtor.com’s latest Housing Alignment Report, from senior economist Jiayi Xu, catches something the closing data cannot. It is not just that cheap homes are selling less. It is that people have stopped looking at them.
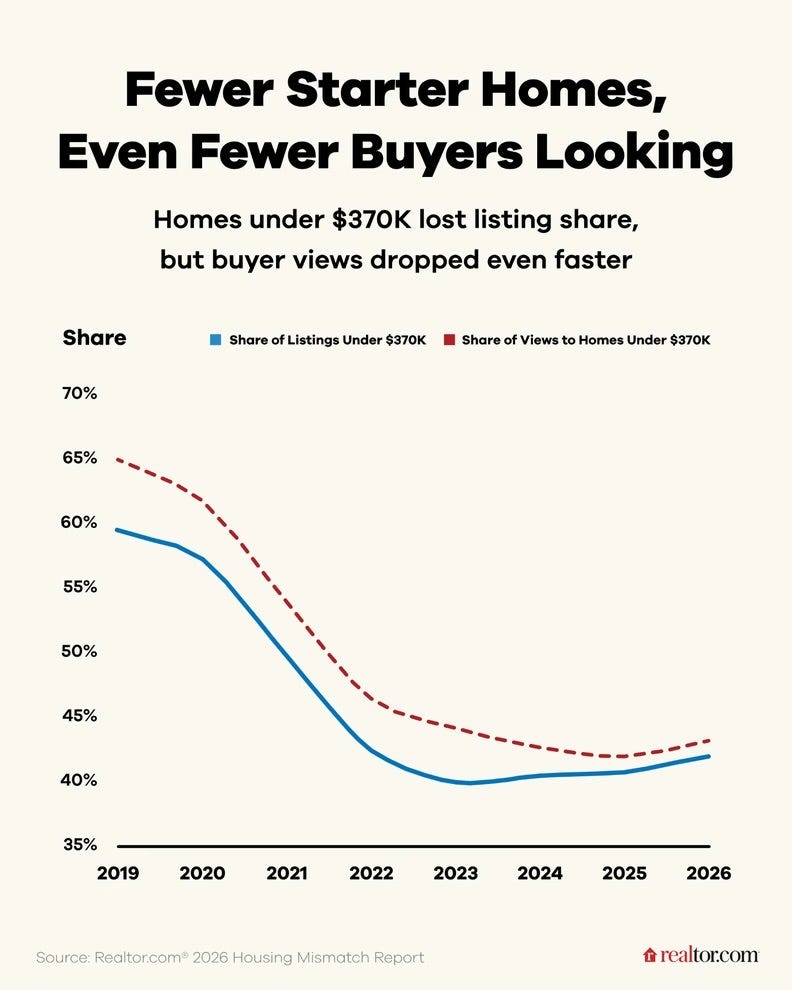
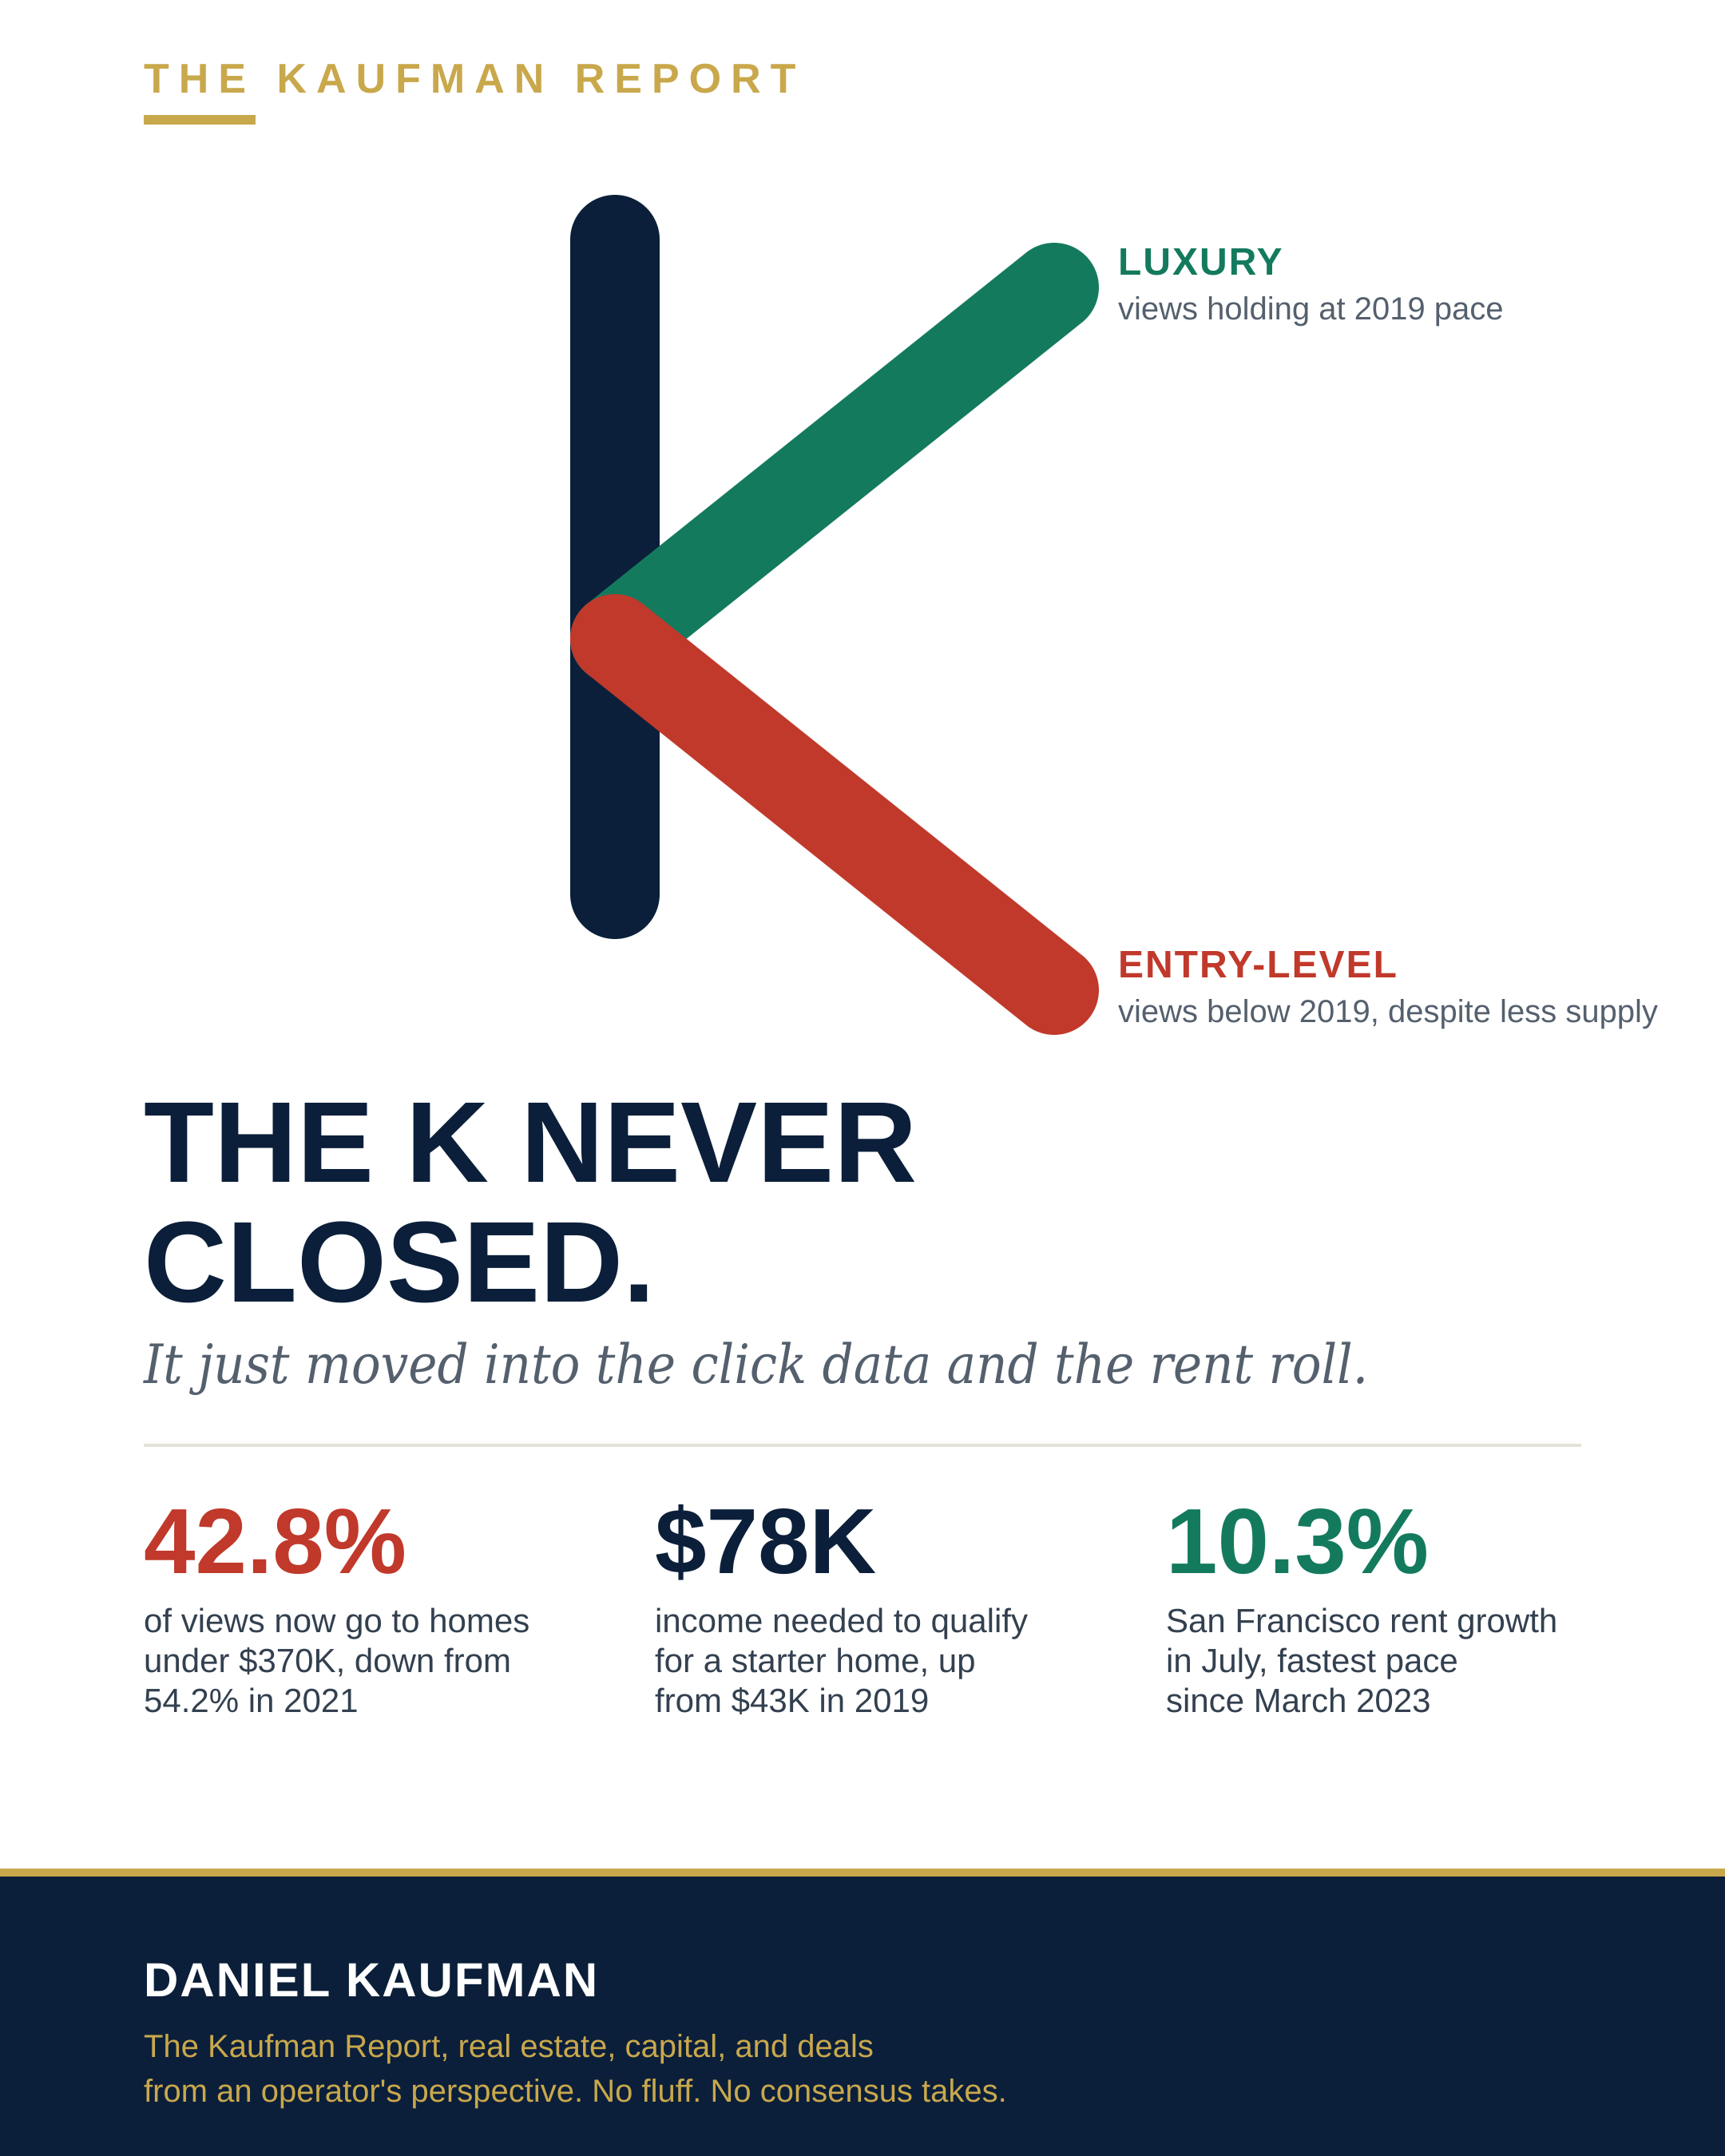
There are fewer entry-level homes on the market than there were in 2019. Normally, scarcer supply pulls more attention toward what is left. Instead, views per property at the entry level have fallen below their 2019 pace. Xu calls it an exodus of entry-level demand, and she is right to name it that way. This is not a supply problem showing up as a demand problem. It is buyers removing themselves from the market before supply even gets a chance to matter.
Luxury tells the opposite story. Inventory above the top tier has grown significantly since 2019, and views per property have barely moved off their pre-pandemic level. More product, same appetite. That is not a coincidence, it is a function of who is shopping in that tier and what they are shopping with. More than 40% of homes that sold above $1 million from January through April were cash purchases. At $2 million and up, cash buyers were the majority.
Gary Lanham, a broker in South Florida, put it the way I hear it from my own buyers. People are sitting at home doing the monthly payment math before they ever pick up the phone to schedule a showing. If the number does not work, the house never gets a showing, never gets an offer, never gets counted as demand at all. It just disappears from the funnel, quietly, before it ever reaches an agent’s pipeline.
Libby Tritschler, an agent in Fairfield County, framed the real dividing line correctly. It is not rich versus poor. It is buyers with financial flexibility against buyers without it. One is asking if the house is worth the price. The other is asking if the payment is even possible. Those are two different markets wearing the same MLS.
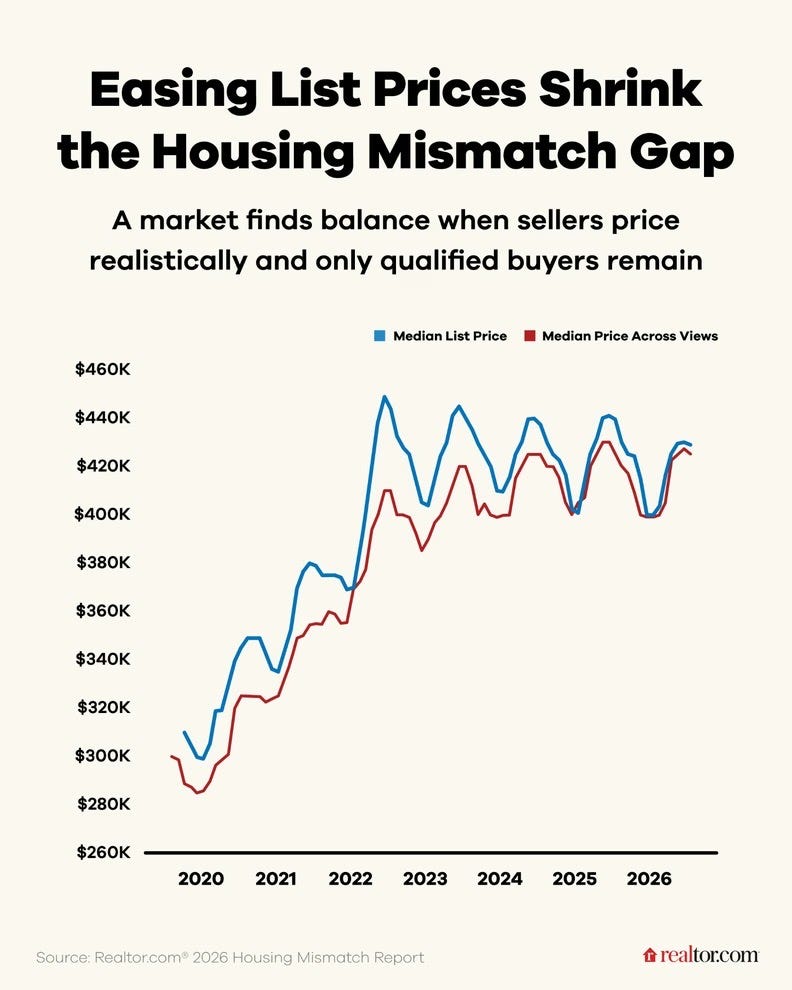
Here is the part that should worry anyone reading the topline numbers as good news. The gap between median list price and the median price of homes actually being viewed has shrunk from $39,000 in June 2022 to under $4,000 today. Inventory mix and shopper attention have nearly converged. That looks like balance.
It is not balance. It is retreat. Xu is direct about this: surface-level balance masks K-shaped market dynamics. Sellers cut prices 2.4% over the past year to meet buyers where they are. Price-sensitive shoppers did not get pulled back in by that. A household earning $75,000 can afford 23% of listings nationally, when a balanced market would put 44% in reach. The income needed to qualify for a starter home has gone from roughly $43,000 in 2019 to $78,000 now. Renting a starter home is cheaper than buying one in every one of the 50 largest metros, saving renters an average of $858 a month. Given that math, staying out of the market is not irrational, it is the correct read of the numbers.
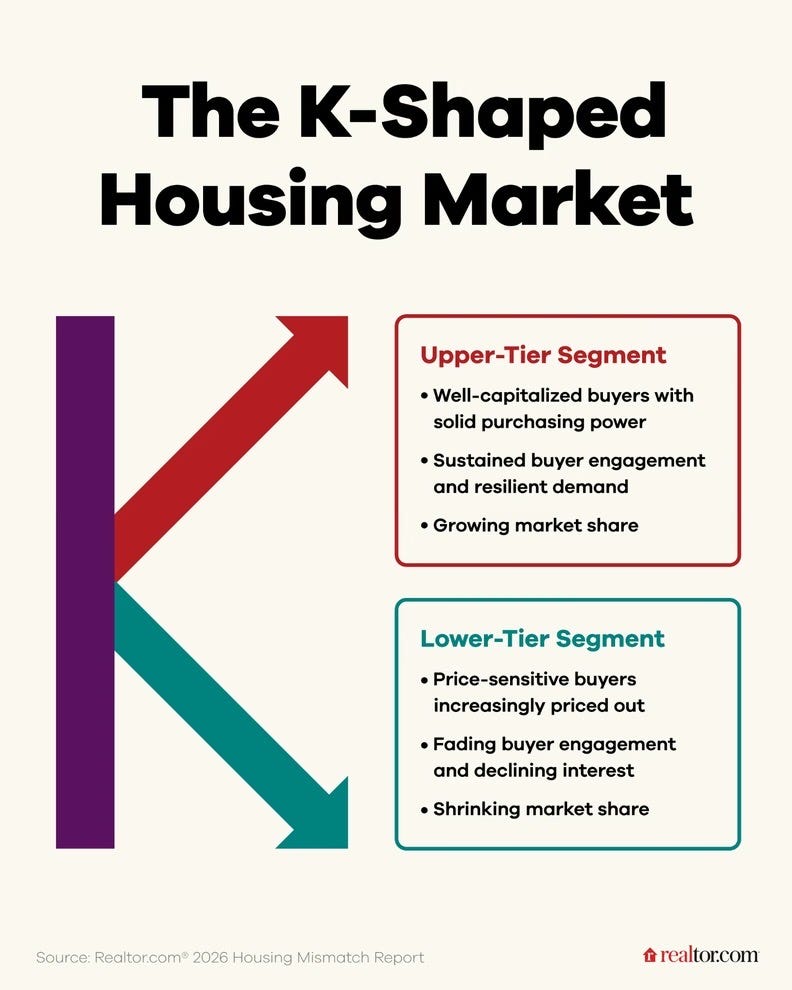
That is the K, sitting right there in the click data before a single offer gets written.
The Rental Market Has the Same Shape
If entry-level buyers are retreating to renting, it is worth asking what kind of market they are retreating into. It is not one market either. It is bifurcated in exactly the same way.
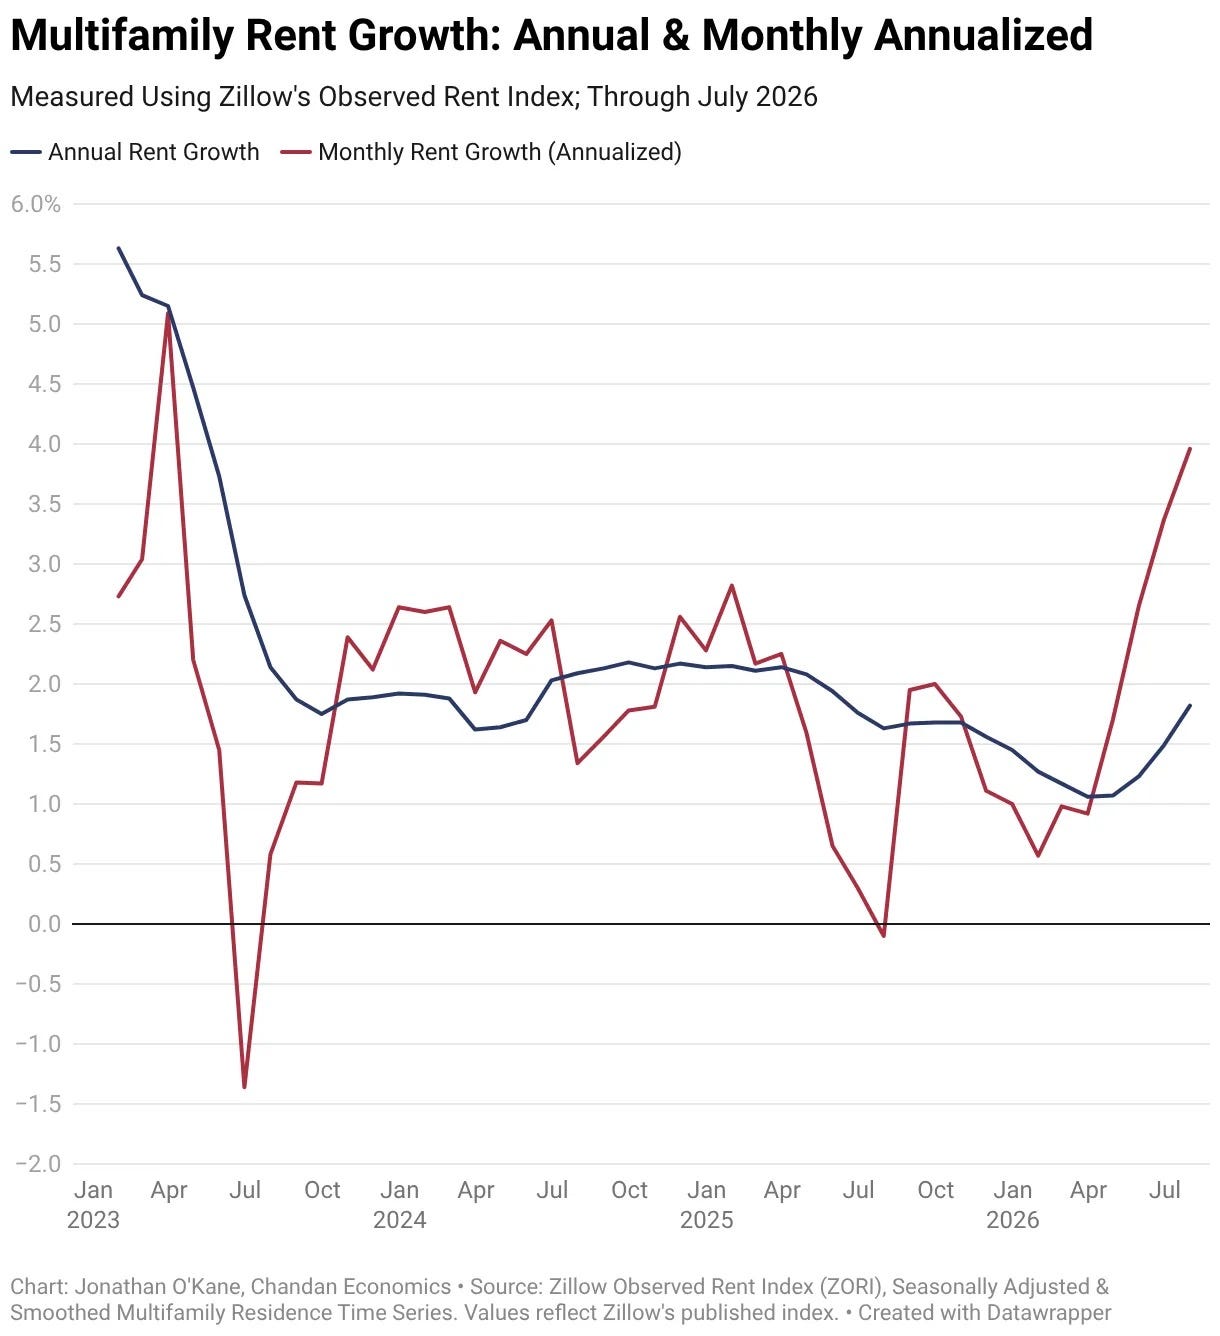
National multifamily rents rose 1.8% year over year in July, per Chandan Economics, up from 1.5% in June and 1.2% in May. Annualized month over month growth hit 4.0%, the fastest pace since March 2023. That is a real reacceleration, and it is broad based, 73.4% of metros posted monthly gains and 88.8% posted annual gains, both the highest shares since September 2025.
Broad based does not mean even. San Francisco rents jumped 10.3% annually and 1.6% in July alone. San Jose ran 7.3%. Those are supply constrained coastal markets where limited new development is colliding with strong demand, and landlords are pricing that scarcity in real time.
Now look at where rents are still falling. North Port down 3.8%. San Antonio down 3.2%. Cape Coral down 3.1%. Denver down 1.9%. Austin down 1.8%. Every one of those markets built through the pandemic boom and is still digesting the supply. Even there I would not call it broken. Austin, Raleigh, Phoenix, Tampa, Denver, and Charlotte all posted positive monthly growth in July, which tells me some of these oversupplied markets are close to finding a floor. But floor is not the same as pricing power, and pricing power is exactly what the supply constrained coastal markets have and the Sun Belt markets do not.
Supply is the variable doing the work here, not demand sentiment, not a national mood. Where the pipeline is thin, rent growth accelerates. Where the pipeline is still working through 2022 and 2023 deliveries, rent growth stays soft even as absorption improves. That is a submarket story wearing a national headline.
Even the Steady Region Is Showing a Crack
The Midwest has been the boring, stable counterweight to all of this, and I mean that as a compliment. Only 11% of new apartment units delivered nationally in 2024, roughly 65,000 units, landed in Midwest metros, even though the region holds 18% of the country’s existing market rate inventory. Inventory growth over the past 12 months ran at 1.1%, in line with the region’s average since 2010. That discipline is why most Midwest markets are running occupancy above the 95.5% national average, with Youngstown at 99.4% and Champaign-Urbana at 97.9% in the second quarter.
But the Midwest just posted the only net job losses of any US region in mid-2026, according to Realpage. That is new, and it is already showing up in the rent tiers. Class C rent growth slowed to 0.5% year over year in the second quarter. Class B is up 1.5%. Class A, still outperforming the national average at 3%, has decelerated from 4.3% a year earlier. The trajectory across every class is the same direction, down, even if the absolute numbers still look fine next to the Sun Belt.
A handful of markets are bucking it. Champaign-Urbana at 5.8%, Youngstown at 5.2%, Fort Wayne at 4.2%, all well above the region’s 3.3% long-term average. Meanwhile Sioux Falls and Lincoln, both running supply well above the regional pace, are showing weaker fundamentals, and Des Moines and Ann Arbor posted outright annual rent cuts. Even inside the boring, stable region, the split is starting to show up between markets that kept supply disciplined and markets that did not.
The Single Point
Strip away the geography and the price tier and you are left with one mechanism repeating at every level of housing. The buyers and renters with financial flexibility keep engaging with the market regardless of headline conditions. The ones without it withdraw quietly, before a showing, before a lease signing, before they ever register as a data point anyone is tracking in real time.
Entry-level home shoppers are not catching up, they are leaving the funnel. Luxury buyers are absorbing new supply at the same pace they always have because price barely constrains them. Coastal rental markets with thin pipelines are compounding pricing power while Sun Belt markets digest the deliveries they built at the top of the cycle. Even the Midwest, the one region built for stability, is starting to show the first signs of the same divide as its labor market softens.
Bessent’s case rests on wage convergence, and the wage data may well be doing what he says it is doing. But housing does not move on wage averages. It moves on who still shows up to look, who still qualifies for the loan, and who still has enough cash flexibility to absorb a soft submarket without flinching. By every one of those measures, the K is still fully intact. It just moved from the headline you are reading to the click data and the rent roll underneath it.
The Kaufman Report covers real estate markets, capital, and deals from an operator’s perspective. No fluff. No consensus takes.