
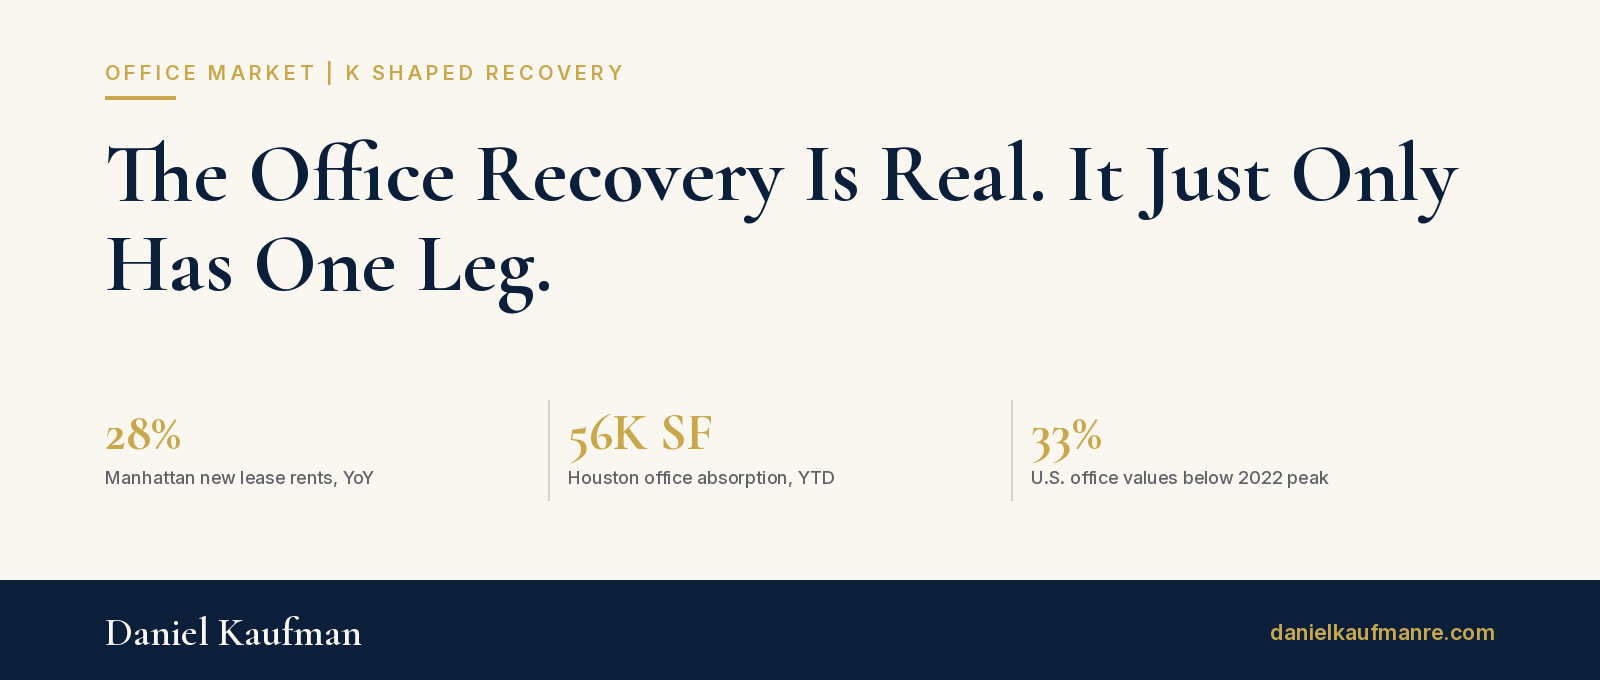
Two office reports crossed my desk this week, and read side by side they tell you more than either one does alone. CRE Daily reported that new direct lease rents in Manhattan averaged $99 per square foot over the trailing twelve months through September, up 28 percent from a year earlier, citing Avison Young data. Three days later, CRE Daily reported that Houston posted positive office absorption for a second straight quarter, citing JLL, but year to date that adds up to only about 56,000 square feet in one of the largest office markets in the country.
Both are recovery headlines. They are not the same recovery. This is the K shaped economy showing up in office, and if you underwrite the sector as one asset class you will get it wrong in both directions.
The top leg is broadening
The Manhattan story is no longer a trophy tower story. Per the Avison Young figures CRE Daily cited, overall availability fell 290 basis points to 13.4 percent, the lowest since 2020, and Class A and Class B/C space now land at similar net effective rents of roughly $83 per square foot once concessions are counted. Year to date leasing reached 30.2 million square feet, the second strongest pace through the third quarter since 2014. Avison Young’s busyness tracker put Manhattan at 86.2 percent of pre-pandemic office activity, against a 70.8 percent national average.
That last number is the one I care about most. Rent follows bodies. When people are physically back, tenants compete for whatever space is left, concessions shrink, and the discount that used to separate a great building from an average one starts to close. That is what demand broadening past trophy actually looks like.
The bottom leg is still on the floor
Houston is the other picture. JLL’s data, as reported by CRE Daily, shows that all of the space newly leased in the third quarter was Class A, mostly in buildings delivered since 2015, and that top tier space rents for about 65 percent more than older stock. Leasing volume was healthy, close to 8 million square feet year to date, but most of that activity is tenants trading up and leaving older buildings behind. JLL’s own Texas research lead described the market as walking a fine line between occupancy gains and losses.
That is not a recovery for the owner of a 1980s tower on the edge of town. That is a migration out of his building.
Pricing has not caught up to either story
Green Street’s Commercial Property Price Index, covered by CRE Daily on October 9, still has office values 33 percent below their 2022 peak, the widest gap of any sector, even though office prices were up about 5 percent year over year. One national index cannot price a market where Manhattan Class B is converging with Class A while a Sun Belt city fills only its newest buildings. The average hides both the winners and the losers.
And the cost of capital is moving against everyone. CRE Daily’s market snapshot had the 10-year Treasury at about 5.23 percent at the October 8 close, and Green Street warned that persistently higher yields could push values down again. Assets with real income growth can absorb that. Assets waiting on a recovery that is not coming to their tier cannot.
Where I see opportunity, and where I see trouble
The opportunity sits in the middle of the top leg: well located Class B in markets where demand has clearly broadened, where rent convergence is real, and where the basis still reflects the panic pricing of the last few years. In Manhattan that window is closing fast. The next places to look are markets where office attendance is high and new supply is close to zero.
The trouble is the bottom leg wearing a recovery headline. Older, commodity office in markets where new Class A is still soaking up all the demand does not get rescued by positive absorption numbers. It gets emptied by them. Even the strong market has a test ahead: CRE Daily also noted $8.7 billion of New York commercial loans maturing within twelve months, 58 percent of it office.
What I am watching next: whether Houston’s leasing starts to reach Class B space the way it has in Manhattan, whether the 10-year holds above 5 percent into year end, and whether lenders start pricing office by tier and by attendance instead of by asset class. Data over emotion. The headline says office is back. The data says some of it is.
I break down stories like this one every day in the Perspectives section of the U.S. Real Estate Journal. If you want an operator’s read on the numbers before they become consensus, start at https://www.usrealestatejournal.net
About the Author
I’m the founder and CEO of Kaufman & Company, a private investment and holding firm working across real estate development, venture investment, and infrastructure. My focus is workforce housing and employer-anchored development, including mountain resort communities through Oldivai.
Reach me at Daniel@kaufmanredev.com or find more at danielkaufmanre.com.
Sources
Manhattan Office Rents Climb 28% as Demand Broadens Past Trophy, CRE Daily, October 6, 2026, https://www.credaily.com/newsletters/new-york/issue/manhattan-office-rents-climb-28-as-demand-broadens-past-trophy/
Houston Office Absorption Turns Positive for Second Quarter, CRE Daily, October 9, 2026, https://www.credaily.com/briefs/houston-office-absorption-turns-positive-for-second-quarter/
CRE Price Recovery Stalls as Higher Yields Threaten Further Declines, CRE Daily, October 9, 2026, https://www.credaily.com/newsletters/national/issue/cre-price-recovery-stalls-as-higher-yields-threaten-further-declines/