
Two data points crossed my desk this week, and together they explain more about the housing market than any mortgage rate headline.
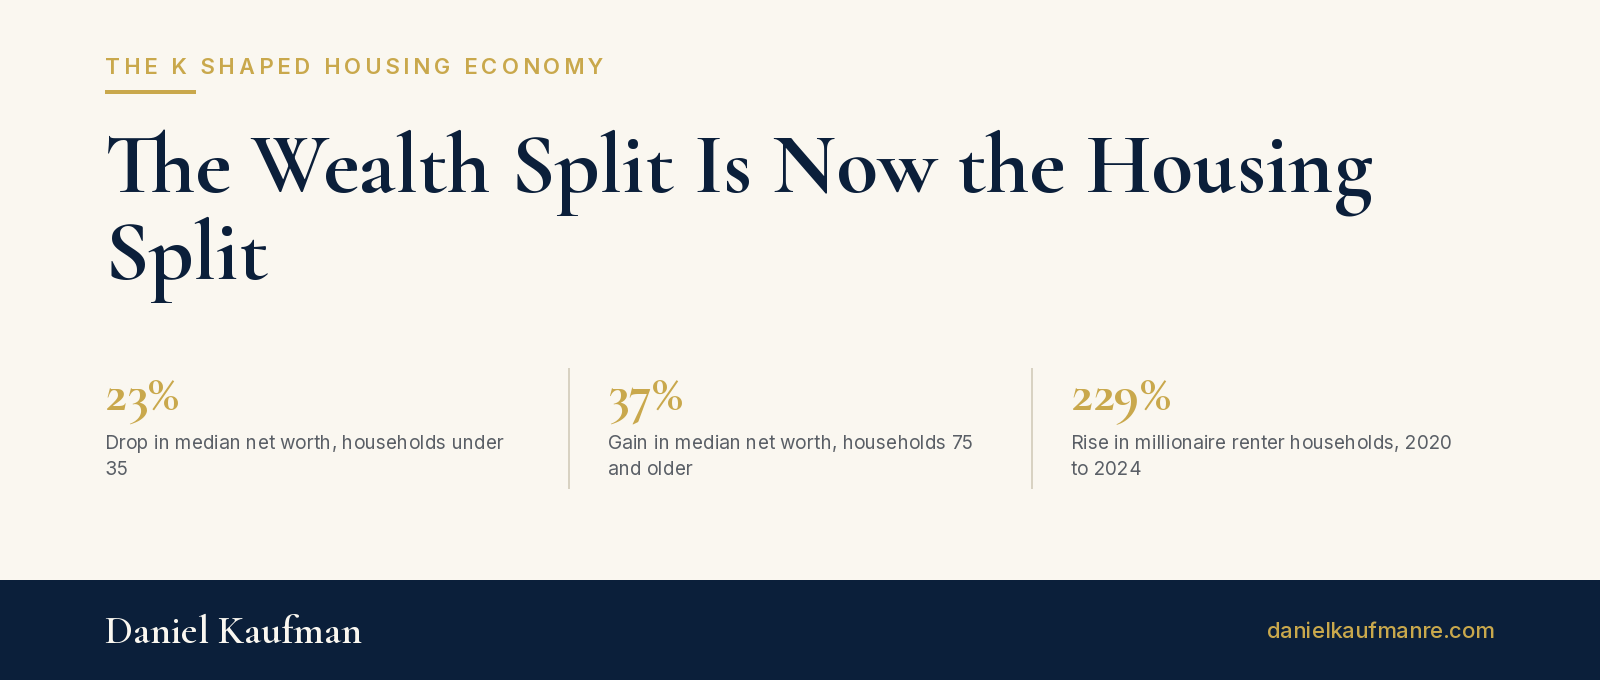
The first: CRE Daily, summarizing a GlobeSt report on new Federal Reserve data, reported that median net worth for households under 35 fell 23% from 2022 to 2025 after inflation. Over the same stretch, median net worth for Americans 75 and older rose 37%. The typical household overall gained just 2%, to $216,900, while the mean rose 7% to $1.24 million. When the average climbs more than three times as fast as the middle, the gains are pooling at the top.
The second: Realtor.com reported on a RentCafe analysis of Census data showing that households earning at least $1 million a year and renting rose 229% from 2020 to 2024, to roughly 18,400 households. Nearly half of them are millennials, and nearly 74% live in just eight metros, led by New York.
Put those side by side and you get the K shaped housing economy in its plainest form. The top arm of the K rents by choice, keeps its capital liquid, and moves when the job moves. The bottom arm rents because the door to ownership closed, and it loses ground every year it waits.
What the numbers actually say
I want to be careful here, because both stories are easy to overread. Realtor.com senior economist Hannah Jones noted that the millionaire renter surge partly reflects a small starting base and a nominal income threshold that more households cross every year. Owners still dominate that income bracket by a wide margin. Renters went from about 8% of it to just under 9%.
CRE Daily, following GlobeSt, also cautioned that rising aggregate wealth says little about where spending or property demand is headed. That is exactly the point. The aggregate looks healthy. The median under 35 does not.
Here is the part that matters for anyone who builds or lends. Realtor.com noted that the typical first-time buyer is now 40 years old, a record, and first-time buyers made up just 21% of purchases. Meanwhile Freddie Mac has the 30 year fixed rate at 7.40%, per Realtor.com, against 6.27% a year ago. The household that lost nearly a quarter of its net worth is the same household that now needs more cash to offset a higher rate. That is not a cyclical delay. That is a cohort being priced out of the asset that built every prior generation’s balance sheet.
Where I see opportunity
The obvious trade is luxury rental, and the market already found it. Realtor.com cited Moody’s data, via Fannie Mae, showing about 86.3% of apartments completed in early 2024 were Class A. The affluent renter is well served.
The underserved customer is the bottom of the K that still has a paycheck: nurses, teachers, technicians, plant workers. That is where I think workforce housing, especially employer anchored development, earns its place. An employer who needs people within commuting distance has a reason to help solve the land and capital stack. A renter who cannot build wealth through ownership benefits from a rent they can actually save against. And product sized for that household, smaller homes, attached product, and rent-to-own structures, is still thin on the ground.
Where it breaks
Two risks. First, if you underwrite a project off headline household wealth, you will overestimate what your actual tenant can pay. CRE Daily made the same point: underwrite the customer base the building serves, not the national average. A senior community serving asset rich retirees and a garden apartment serving 28 year olds live in different economies.
Second, the top of the K is mobile by design. Realtor.com cited Census data showing that people in rented homes moved at more than three times the rate of people in owned homes in 2024. Luxury rental demand that follows high paying jobs can leave when those jobs do. Anyone building at the top end in a single industry town should price that in.
What I am watching
Whether younger renters start to show up in delinquency and concession data, whether employers start treating housing as a recruiting cost rather than someone else’s problem, and whether the next Fed survey shows this gap closing or compounding. Based on the data so far, my bet is compounding. Data over emotion: the middle of this market is not going to recover on its own.
We publish this kind of analysis every morning in our Perspectives at the U.S. Real Estate Journal. If you want the daily read on where the K is widening and where it is not, start at https://www.usrealestatejournal.net.
About the Author
I’m the founder and CEO of Kaufman & Company, a private investment and holding firm working across real estate development, venture investment, and infrastructure. My focus is workforce housing and employer-anchored development, including mountain resort communities through Oldivai.
Reach me at Daniel@kaufmanredev.com or find more at danielkaufmanre.com.
Sources
Wealth Gap Widens as Young Households Lose 23% of Net Worth, CRE Daily, October 15, 2026, https://www.credaily.com/briefs/wealth-gap-widens-as-young-households-lose-23-of-net-worth/
Why Millionaire Renters Have More Than Tripled Since 2020, Realtor.com, October 16, 2026, https://www.realtor.com/news/trends/millionaire-renters-triple-since-2020-rentcafe/
Mortgage Rates Hold Steady at 3-Year High as Bond Market Stabilizes, Realtor.com, October 15, 2026, https://www.realtor.com/news/trends/mortgage-rates-inflation-today-october-15-2026/