THE KAUFMAN REPORT
What the immigration-driven collapse in break-even employment growth means for developers, operators, and anyone reading payroll reports right now.
Everyone’s watching the jobs numbers and asking the wrong question.
The headline payroll prints have been soft. Month after month, the numbers come in below where they were two and three years ago, and the commentary follows a predictable script: the labor market is cooling, demand is weakening, the economy is losing steam. The Fed watchers weigh in. The recession prognosticators resurface. The narrative writes itself.
Here’s what most of that commentary is missing: the benchmark moved.
I’ve been tracking a body of research out of the Dallas Fed and Syracuse University that reframes how to read recent employment data — and the implications for real estate operators are more significant than the headlines suggest. Let me walk through it.
The Break-Even Rate Is the Number Nobody Talks About
Before you can evaluate whether a payroll number is strong or weak, you need to know the break-even rate — the number of net new jobs required each month just to keep the unemployment rate where it is. It’s not a fixed number. It shifts with population growth, demographic trends, and critically, labor force participation.
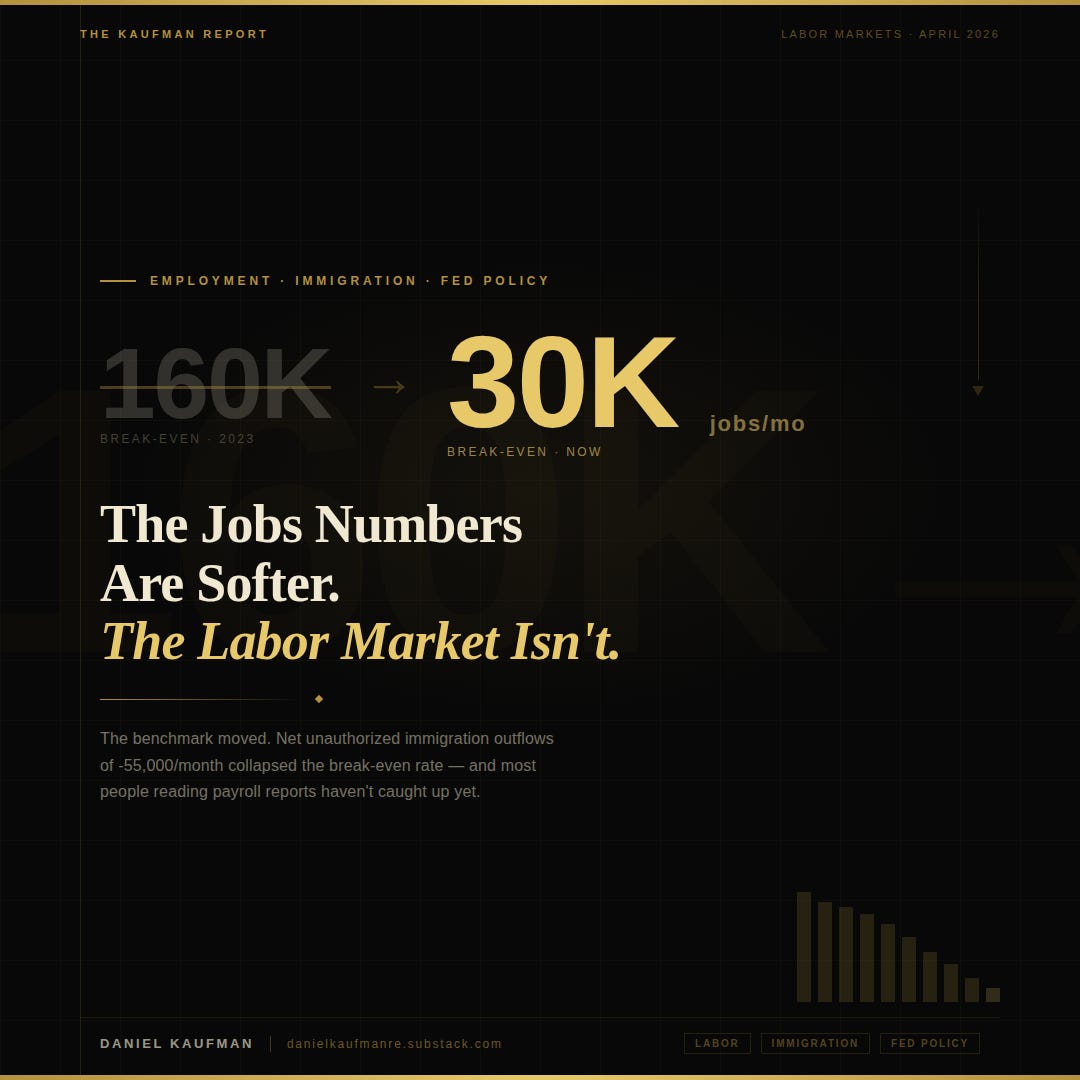
When net immigration is running hot — as it was from 2021 through early 2024 — the break-even rate rises. More people entering the workforce means you need more jobs just to hold the line on unemployment. During that period, the benchmark was running around 160,000 jobs per month.
That number has collapsed. And most people reading payroll reports haven’t updated their mental model to account for it.
What the Immigration Data Actually Shows
Here’s where it gets concrete.
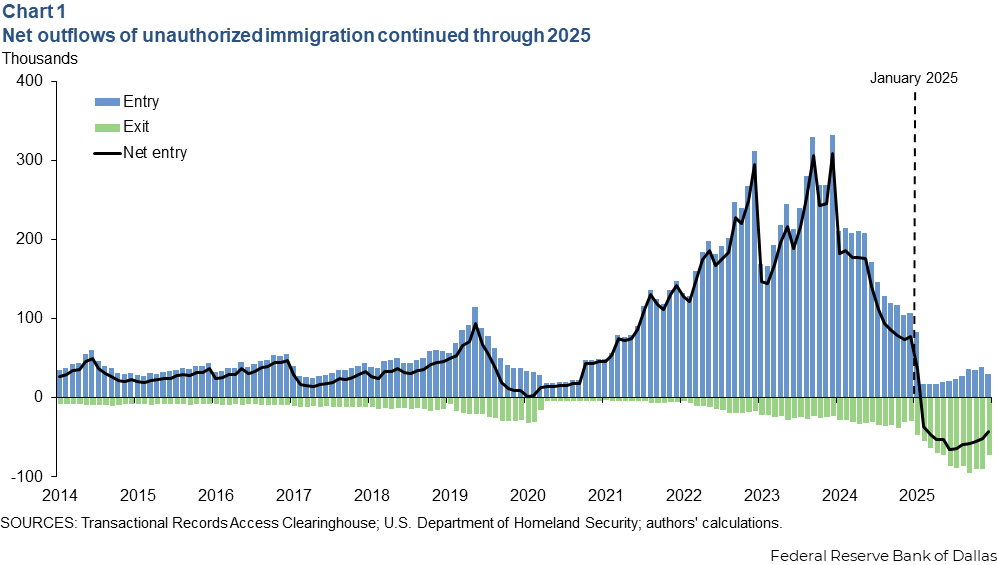
Using FOIA-obtained immigration court microdata from the Transactional Records Access Clearinghouse at Syracuse University — the most granular real-time dataset available on this — researchers have tracked net unauthorized immigration through December 2025. The picture is unambiguous.
Net unauthorized immigration turned negative in February 2025 and has stayed negative. Through the second half of 2025, the net outflow averaged -55,000 per month. That reflects enforced deportations, removal orders from immigration courts, and voluntary exits driven by country-specific changes to Temporary Protected Status termination dates.
The surge of 2021–2024 has fully reversed. We’re not at zero. We’re negative.
Why This Matters for How You Read the Labor Market
When the workforce is shrinking rather than growing, you need fewer new jobs to maintain labor market stability. The break-even rate drops.
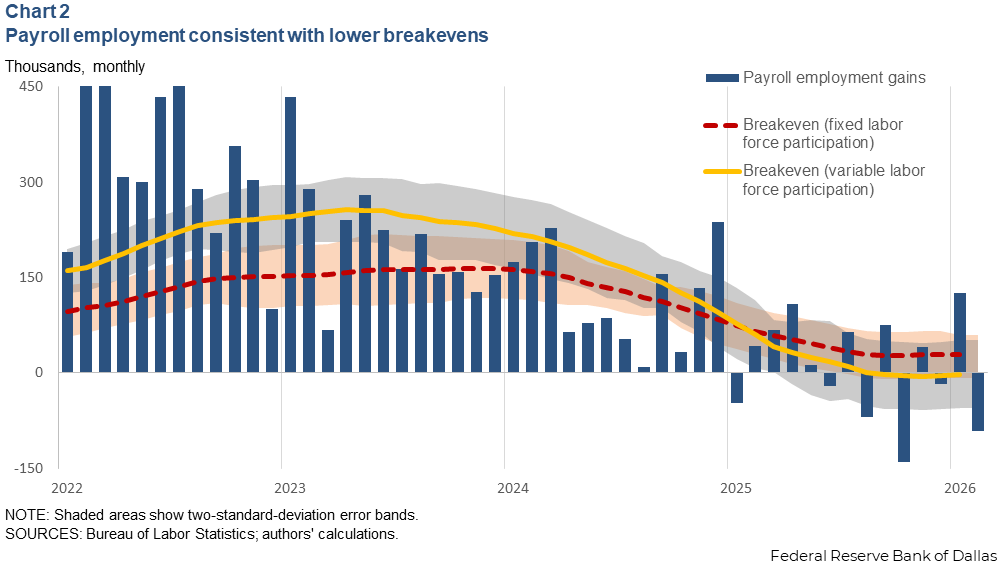
The updated estimates put break-even employment growth at roughly 30,000 jobs per month by end of 2025, down from 160,000 in 2023. That’s not a rounding error. That’s a fundamental reset of the baseline. Declining labor force participation amplifies it further.
The Punchline: Recent Payroll Growth Is Actually Above Break-Even
December 2025 through February 2026 actual payroll growth slightly exceeded the updated break-even rate on average. The unemployment rate held stable — not because the economy is roaring, but because the bar for labor market stability moved significantly lower.
Payroll prints that would have signaled slack two years ago are now consistent with a balanced labor market.
What I’m Taking Away as a Developer and Investor
Wage pressure stays elevated. A tighter labor pool means continued pressure in construction trades, hospitality, and service sectors. Anyone underwriting labor cost normalization is making an assumption the data doesn’t support.
The Fed’s read of the labor market matters for rates. If policymakers are benchmarking against the old break-even rate, they may read the labor market as looser than it is — and keep rates higher longer than conditions warrant. This is a live policy debate with direct implications for cap rates and financing costs.
Workforce housing demand shifts in specific submarkets. Net outflows of 55,000 per month create real vacancy pressure where unauthorized immigrant populations have historically concentrated — gateway cities, agricultural regions, high-density service corridors. That needs to be in the underwriting.
Read the data, not the headline. The jobs market “softening” story is real as a headline. As a description of underlying labor market health, it’s misleading. The benchmark moved. Most of the commentary hasn’t caught up.
The Bottom Line
The U.S. labor market is not as soft as the headline numbers suggest — because the baseline for evaluating those numbers has shifted dramatically. Break-even has dropped from 160,000 to roughly 30,000 jobs per month. Recent payroll growth has cleared that bar.
For real estate operators and investors: sustained wage pressure in labor-intensive sectors, a Fed that may be reading the market with a lag, and specific submarket exposure in workforce housing that needs to be modeled explicitly.
The data is there. Most people aren’t reading it closely enough.
Daniel Kaufman | Principal & CEO, Kaufman & Company