
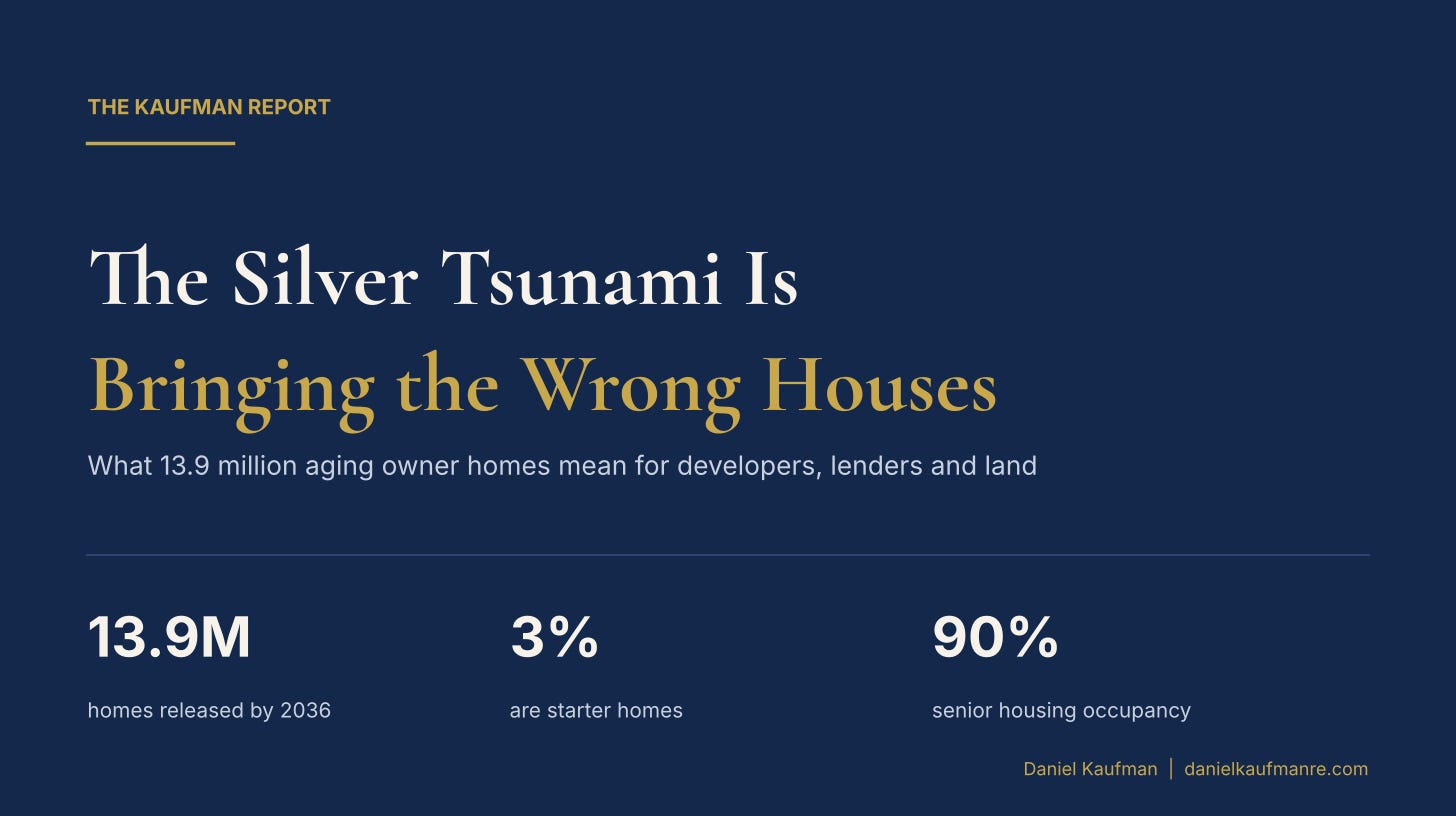
Realtor.com put out its Generational Housing Succession report this morning, and most of the coverage will read it as good news for house hunters. More homes are coming. Inventory gets restored. Buyers finally get some leverage.
That’s the homeowner read. I want to give you the investor read, because it’s a different story. The silver tsunami isn’t a supply wave. It’s a product mix problem and a geography problem, and both of those decide where capital makes money over the next ten years and where it gets hurt.
The numbers
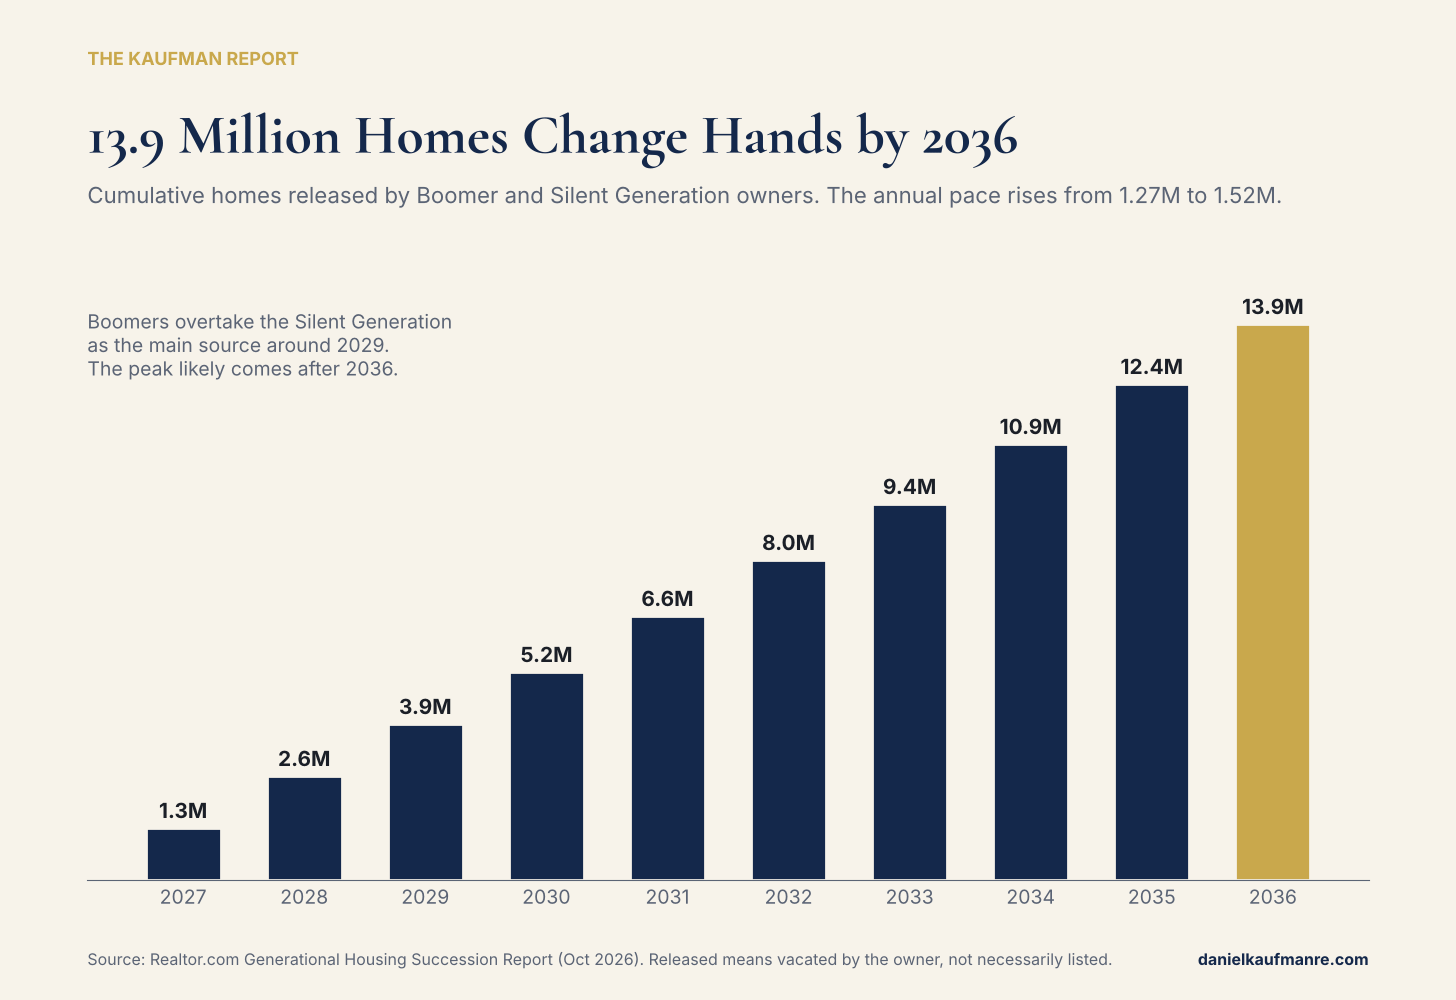
Baby Boomers and the Silent Generation own an estimated 36.7 million homes today. By 2036, Realtor.com projects that drops to 22.8 million. That’s 13.9 million homes released from older owner occupancy, about 1.39 million a year, and 74% more than these same generations gave back over the last decade.
The pace keeps climbing, from about 1.27 million homes in 2027 to 1.52 million in 2036. The oldest Boomers turn 80 this year. Boomers pass the Silent Generation as the main source of released homes around 2029, and they are still climbing when the forecast ends. The real peak probably comes after 2036.
One definition matters before anyone builds a model on this. “Released” means the owner left the home through death, a move into care, moving in with family, or a move to a rental. It does not mean the home hits the MLS. Some get inherited and kept. Some get rented. Some sit in an estate for a year. Realtor.com’s own math shows that if just 45% of the 2027 releases became listings, that alone would bring annual listings back to prepandemic levels. You don’t need all of it to change the market. You need less than half.
The supply lands where the shortage isn’t
This is the part every developer needs to sit with.
Of the 13.9 million homes, only about 380,000 have two bedrooms or fewer. That’s 38,000 starter homes a year, nationally. Family homes with three or four bedrooms are 9.9 million of the total, about 71%. Homes with five or more bedrooms are another 3.6 million.
Now compare that to what’s actually trading. Average annual releases equal about 3.2% of recent starter home listings, 24.7% of family home listings, and 67.2% of large home listings.
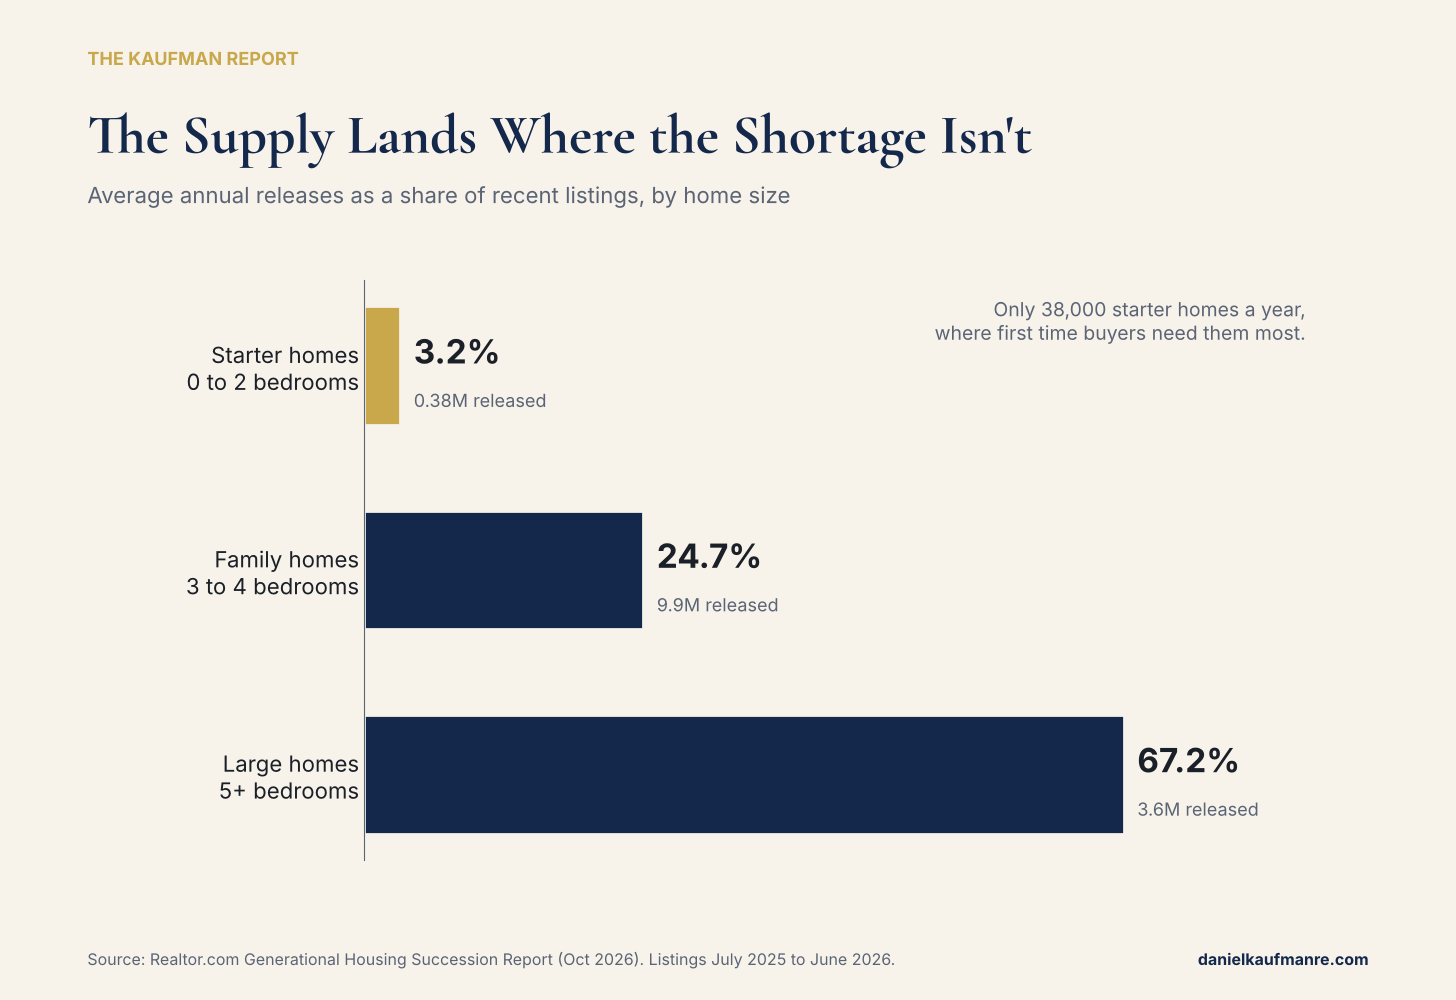
Read that last number again. If even half of the large homes that get released reach the market, large home listings go up by roughly a third. That’s not a softening. That’s a repricing.
Meanwhile, at the bottom of the market, nothing changes. A separate Realtor.com and NAR analysis from May found that homes affordable to a household earning about $75,000 make up just 23% of listings, about half of what a balanced market should look like. The silver tsunami does almost nothing for that buyer.
It gets worse at the entry level, not better. Using recent movers as a proxy for recent buyers, Realtor.com found about 30% of buyers of starter sized homes are 60 or older. Downsizers want the same two bedroom ranch the first time buyer wants. So the aging wave adds supply at the top and adds competition at the bottom.
Jiayi Xu, the Realtor.com economist who wrote the report, said it plainly: the trade up chain that frees starter homes is a secondary channel that takes time, and “the primary solution to the starter home shortage remains more new construction.”
That sentence is the whole investment thesis.
Fewer new households to absorb it
Supply is only half the equation. On the demand side, Harvard’s Joint Center for Housing Studies projects household growth of about 8.6 million from 2025 to 2035, roughly 860,000 a year. That’s below every one of the last three decades. From 2035 to 2045 it drops to 5.1 million, which would be the weakest decade of household growth in at least 100 years.
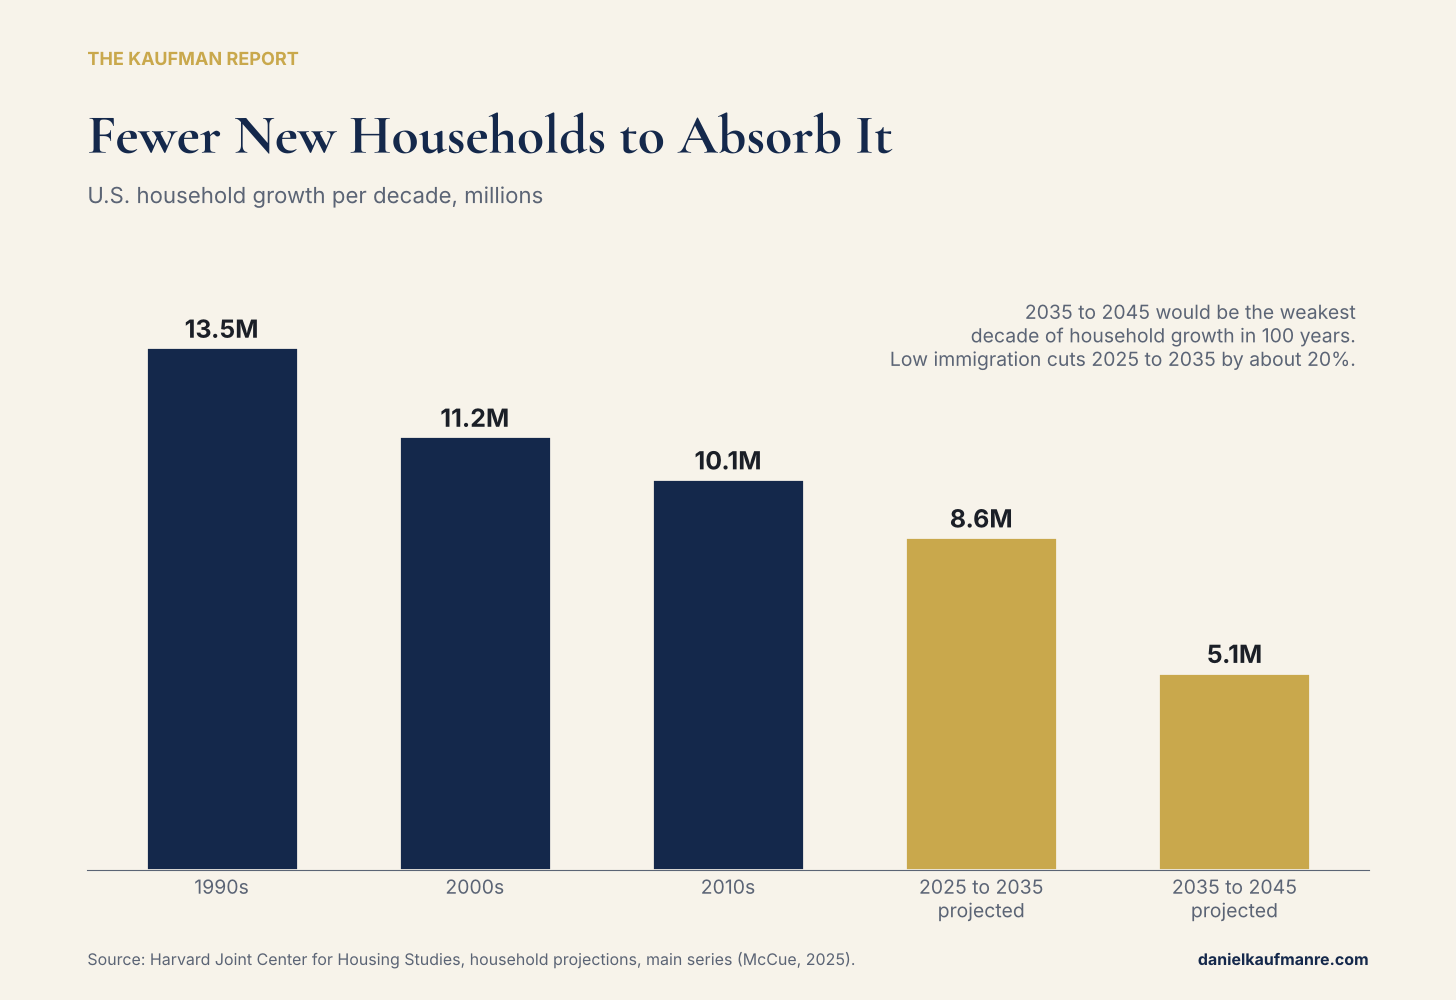
JCHS translates that into new construction demand falling from about 1.4 million homes a year to roughly 1.1 million. Under their low immigration scenario, household growth from 2025 to 2035 falls by about another 20%. And the fastest growing household type over the next decade is a single person over 65. Households headed by someone 80 or older grow by close to 60% by 2035.
So the generation releasing the homes is also reshaping what demand looks like. Smaller households. Older households. More renters. Fewer young families needing four bedrooms on a half acre.
Put that on top of where the market already is. Realtor.com’s September report showed 20.8% of active listings with a price cut, the highest September share since 2018. List prices have been down year over year for 11 straight months. Inventory is within about 9% of prepandemic norms. The tsunami isn’t landing on a tight market. It’s landing on one that’s already loosening.
Nobody is forcing them to sell
Here’s why the timing is uncertain, and why you can’t underwrite this as a straight line.
Older owners mostly don’t have mortgages. NAHB’s analysis of Census data shows 58% of homeowners 65 to 74 own free and clear, 69% of those 75 to 84, and 82% of those 85 and older. Among starter home owners in their 70s, Realtor.com puts the free and clear share at 72.8%, which is a big reason those small homes are the stickiest of all.
No payment means no rate lock and no pressure. These homes come back through life events, not market cycles. That makes the flow lumpy and local. It also means the people on the other side of the transaction are often heirs and estate executors, and heirs behave differently than owner occupants. They live somewhere else. They don’t want to carry taxes, insurance and a roof on a house they’ll never live in. They want it settled. That’s a motivated seller, and in segments where releases run 25% to 67% of listings, motivated sellers set the price.
The place they move to isn’t being built
Every home released through a move into care needs somewhere to go. That’s the other side of this trade, and it’s badly undersupplied.
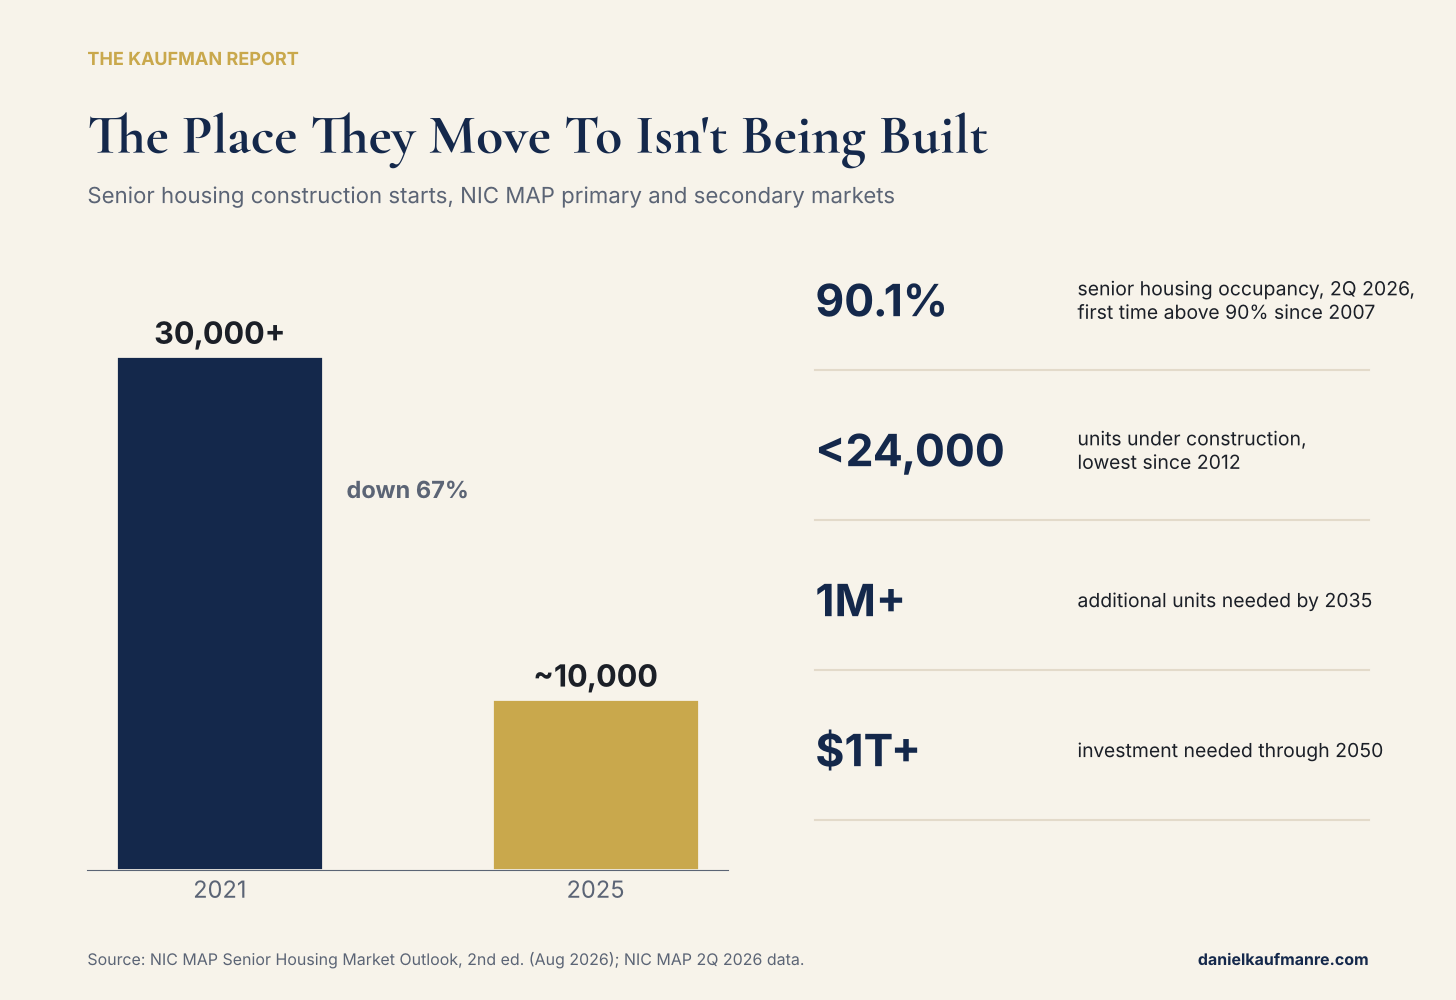
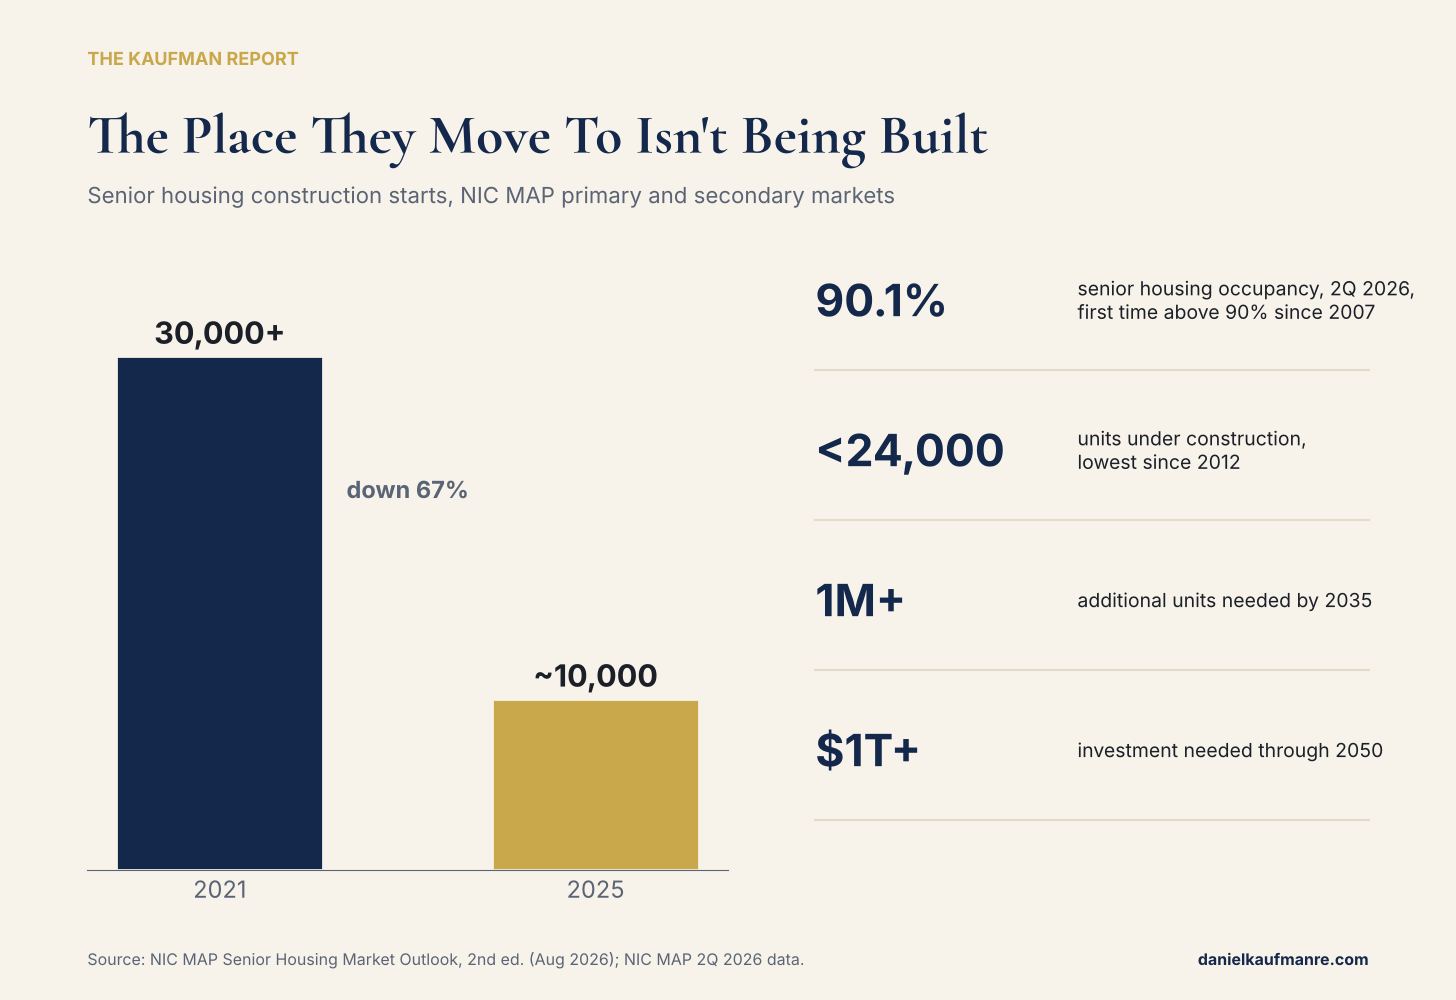
NIC MAP data shows senior housing occupancy across the top 99 metros hit 90.1% in the second quarter of 2026, the first time above 90% since 2007. Construction starts fell about 67% from 2021 to 2025, from more than 30,000 units to roughly 10,000. Units under construction are below 24,000, the lowest since 2012. NIC MAP projects the country needs more than 1 million additional senior housing units by 2035 and more than $1 trillion of investment through 2050 just to hold today’s level of availability.
This connects back to the release forecast in a way most people miss. If there’s nowhere to move, people stay. A shortage of senior housing slows the silver tsunami. Building senior and active adult housing doesn’t just serve an aging population, it unlocks the family homes sitting behind them. And it’s largely self funded demand. The median 65 and older household holds about $250,000 in home equity. The house pays for the move.
Geography decides everything
National averages are useless here. NAHB mapped where older owners are concentrated against how strong local household formation is, and the markets fall into four buckets.
Oversupply risk. Large shares of older owners, weak or negative population growth. NAHB flags Pittsburgh, Buffalo and Rochester. In Pittsburgh, a large share of homes owned by people 65 and older were built before 1980. That stock comes back needing real money, and in a lot of cases it’s a redevelopment play, not a resale.
Absorption markets. Strong household formation, decent affordability, growing population, fewer older owners. Durham Chapel Hill, Knoxville and Jacksonville show up here. These markets can take the extra supply without breaking pricing.
Constrained high cost metros. New York, Los Angeles, San Diego. Huge pent up demand, limited exposure to released homes. The tsunami barely touches these markets. Supply still has to be built.
Senior concentration markets. Mostly Florida. Seven of the ten metros with the highest share of households headed by someone 65 or older are in Florida, led by The Villages at 68.2% and Homosassa Springs at 52.7%. These are the places that get hit with the most released inventory. They are also places where younger households have been squeezed out, so the right product at the right price can be absorbed. The wrong product will sit.
That last group is a big part of why we spend time in Florida. When the turnover is this concentrated, it creates distressed land, estate sales and repositioning opportunities that don’t show up anywhere else. But it cuts both ways. A builder dropping move up spec homes into a retirement heavy county is going to compete with estate inventory priced to close.
How I’m underwriting it
Here’s how this changes the way I look at deals.
1. Stop building the product the tsunami is about to flood. Move up spec homes and large lot executive product in markets with high 65 and older ownership and slow population growth are now competing with free and clear sellers who don’t need to hold out. If your pro forma assumes today’s resale comps for a four or five bedroom home in one of those markets, I’d stress the exit price.
2. Build what the tsunami doesn’t deliver. Entry level and workforce housing. Small lot single family, townhomes, small multifamily, build to rent, ADUs. Before the Great Recession, new homes under 1,800 square feet were about 30% of new single family production. Today it’s closer to 20%. Older owners are only giving back 38,000 starter homes a year. That gap isn’t closing on its own, and it’s the reason workforce and employer anchored housing stays at the center of what we do.
3. Treat estate inventory as land, not as housing. A tired 1970s ranch on a big lot in a good school district is an infill site. Lot splits, duplex conversions, ADUs, teardowns where zoning allows. Large homes can be repositioned too. Multigenerational households grew from 3.2 million to 3.9 million over the last decade, and those listings ask about 65% more than a standard home and still draw more buyer interest. A five bedroom house that’s hard to sell as a single family home can be a strong multigenerational or ADU product.
4. Follow the people, not just the houses. Senior housing and active adult rental are running at or above 90% occupancy with almost nothing in the pipeline. NIC MAP’s own CEO has pointed developers toward secondary and tertiary markets where costs pencil better. That’s a supply gap with funded demand behind it.
5. Underwrite by market bucket, not by headline. A national number like 13.9 million tells you nothing about your deal. Know the 65 and older ownership share, the headship rate for 25 to 64 year olds, five year population growth, and the age of the housing stock in your submarket. Those four numbers tell you whether released homes are a risk or an opportunity.
6. If you lend, watch your collateral. Large home values in slow growth, retirement heavy markets carry more downside than they did two years ago. Construction loans on entry level product in absorption markets look better than they did.
The bottom line
The silver tsunami doesn’t solve the housing shortage. It reshuffles it. The country gets plenty of four and five bedroom homes in places people are leaving, and almost nothing at the price point and size where the shortage actually lives.
For homeowners, that’s a mixed headline. For developers and investors, it’s a map. The opportunity is in building what aging owners aren’t giving back, buying what they are giving back as land and repositioning plays, and financing the places they’re moving into.
Same lesson as always. Follow the data, not the headline.
Sources: Realtor.com Generational Housing Succession Report (Oct. 5, 2026); Realtor.com September 2026 Monthly Housing Trends Report; Realtor.com and NAR affordability analysis (May 2026); Realtor.com multigenerational housing report (May 2026); Harvard Joint Center for Housing Studies household projections (McCue, 2025) and low immigration revision; NAHB Eye on Housing, “The Silver Tsunami Isn’t Landing Where It’s Needed Most” (Apr. 2026) and 55+ homeowner analysis (Sep. 2026); NIC MAP Senior Housing Market Outlook, 2nd ed. (Aug. 2026) and 2Q 2026 data; NCOA home equity data.
About the Author

Daniel Kaufman is the founder and CEO of Kaufman & Company, a private investment and holding firm spanning real estate development, venture investment and infrastructure. His work focuses on workforce housing, employer anchored development, land and mountain resort communities across the Mountain West, Texas, Florida and the Northeast. He writes The Kaufman Report from the operator’s side of the table.
Contact: Daniel@kaufmanredev.com
Website: www.danielkaufmanre.com