
THE KAUFMAN REPORT
danielkaufmanre.substack.com
Metro-wide rent data is burying the real story. Inside Austin, Phoenix, and Denver, the gap between winners and losers has never been wider — and most investors are still reading the wrong scorecard.
The headlines have been screaming “overbuilt” for 18 months. Sun Belt rents are soft. Occupancy is under pressure. Concessions are back. The construction boom is finally catching up to the market.
Here’s what the headlines aren’t telling you: the Sun Belt isn’t broken. It’s bifurcated.
And if you’re making capital allocation decisions based on metro-level data, you’re flying blind.
The Setup: How We Got Here
Pandemic-era population migration was real. Austin, Phoenix, Denver, Tampa — they all saw genuine demand shocks that justified aggressive development pipelines. Developers responded rationally. Then rates spiked, construction timelines slipped, and all that supply is landing at the same time.
The result is a market that looks uniformly soft from 30,000 feet but is wildly uneven on the ground. Class A urban product in supply-heavy submarkets is fighting for tenants with free rent and gift cards. Meanwhile, Class B workforce product two zip codes away is posting strong renewals and outperforming projections.
Same metro. Completely different dynamics.
The Class A Problem Nobody Wants to Say Out Loud
The divide between lifestyle housing and rent-by-necessity housing is widening — and it’s widening fast.
Supply-heavy Class A assets, especially urban infill product built for the aspirational renter, are taking the brunt of this cycle. They’re the ones offering six weeks free. They’re the ones watching effective rents diverge from asking rents in real time.
Class B is a different story. These assets benefit from steady demand, longer average tenancies, and stronger renewal rates even when new lease velocity softens. The renter choosing Class B isn’t choosing it because it’s the coolest building on the block — they’re choosing it because it fits their budget and they’re not moving unless they have to.
That’s not a soft market story. That’s a durable demand story.
Zoom Out on the National Picture — Then Zoom Back In
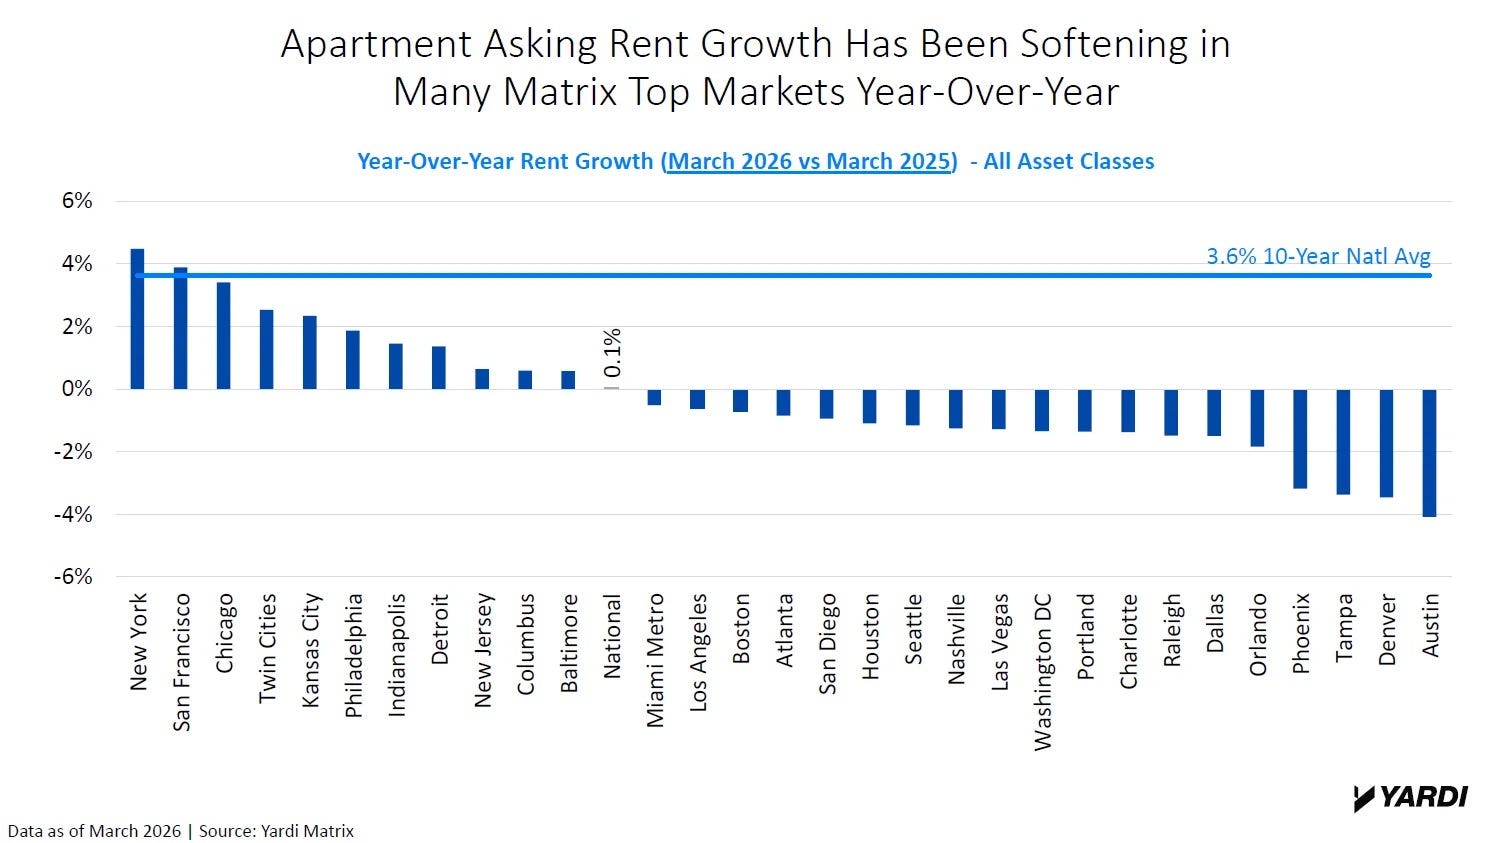
The March 2026 Zillow data is instructive, but you have to read it carefully.
The typical asking rent hit $1,910 — up 1.8% year-over-year. That sounds like a healthy market. Except that was the slowest annual increase since 2020, and single-family rent growth of 2.5% was the lowest Zillow has ever recorded.
But here’s where it gets interesting. Rents fell year-over-year in Baltimore, Richmond, and Minneapolis. Meanwhile San Francisco posted 6.4% growth. Chicago was up 5.6%. Virginia Beach hit 6.0%. Providence came in at 4.9%.
The markets everyone wrote off — the cold-weather, high-tax, “why would anyone live there” markets — are outperforming. The markets everyone crowded into are giving back gains. That’s not a coincidence. That’s a supply story.
In Austin, the typical household saved $3,182 in annual rent versus a year ago. Tampa: $3,110. Denver: $3,002. That’s meaningful relief for renters. It’s painful for operators who underwrote those assets at peak rent assumptions.
And concessions? Forty percent of Zillow listings offered them in March. That number is rising in 33 of the 50 largest metros. Indianapolis, New Orleans, and Memphis are leading the move toward heavier concession usage. That’s your signal on where supply is still winning the battle against demand.
The Affordability Floor Is Higher Than You Think
Here’s what doesn’t get enough airtime in the “rents are falling” narrative: you now need a household income of $76,400 to comfortably afford the average rental. That’s 35% higher than pre-pandemic. Rents as a share of income have eased to 26.5%, approaching the pre-pandemic norm of 25.8% — but the absolute income required to get there has permanently shifted.
That matters for deal underwriting. Demand isn’t going away. But the tenant profile that can absorb current rent levels has narrowed. In markets where wage growth hasn’t kept pace with that affordability reset — and there are plenty of them — you’re looking at structural demand compression, not just a cyclical dip.
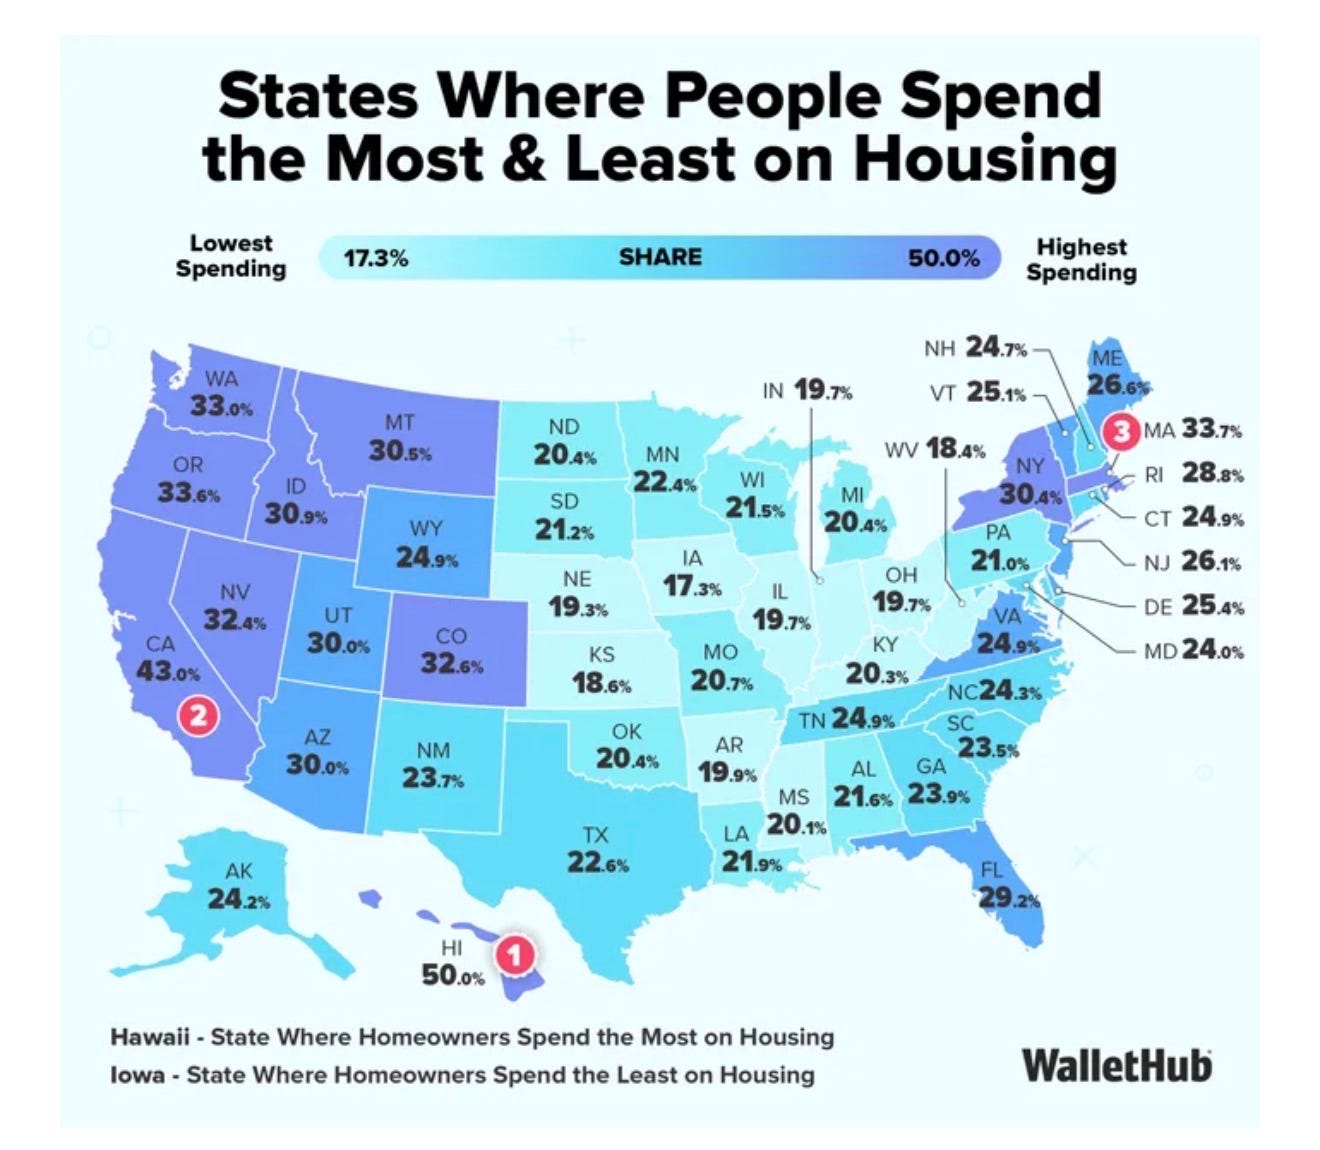
The WalletHub cost-burden data makes the geographic dimension even starker. Hawaii homeowners are spending 50% of median income on housing. Renters in Hawaii and New York are above 60%. California and Massachusetts homeowners are at 43% and 34% respectively. These aren’t markets flirting with unaffordability — they’ve been unaffordable for years, and the people who stayed are either wealthy enough not to care or trapped by circumstance.
On the other end: Iowa homeowners at 17% of income. Oklahoma renters at 20%. These markets don’t generate the same cap rate compression or headline attention, but they absorb supply differently, support stable occupancy, and don’t crater when a new Class A tower comes online.
What This Cycle Is Actually Telling Operators
I’ve said this before and I’ll keep saying it: broad-market bets are how you get hurt in a bifurcated cycle. This isn’t 2012, where you could throw a dart at any Sun Belt market and make money if you held long enough.
The elevated supply pipeline runs through 2028. Long-term demand fundamentals remain intact — job growth, household formation, the structural shortfall in housing starts. But you’re not going to survive to capture that long-term thesis if you’re bleeding occupancy on a poorly positioned Class A asset for the next three years.
The precision required right now isn’t just asset-type precision — it’s submarket precision. Within Austin, there are neighborhoods stabilizing right now while others are still absorbing wave after wave of new supply. Same story in Phoenix. Same story in Denver. The metro average is a composite of stories that have almost nothing to do with each other.
This is the alpha. Not picking the right city. Picking the right block.
The Bottom Line
The Sun Belt isn’t broken. The investors reading metro-level data as if it tells the whole story are.
Supply-heavy urban Class A product will keep facing pressure. Class B workforce housing in less saturated submarkets is your performance story right now. The Midwest and Northeast — markets that got left out of the pandemic trade — are quietly posting some of the strongest rent growth numbers in the country.
Early recovery signals are showing up in select Sun Belt submarkets even as the headline numbers look soft. If you’re waiting for metro-wide stabilization before you move, you’ll be buying into a recovered market at recovered prices.
The operators who win this cycle are the ones who did the submarket work when everyone else was looking at zip codes from a distance.
That’s always been the job. This cycle just makes it more unforgiving when you skip it.
The Kaufman Report covers real estate markets, capital, and deals from an operator’s perspective. No fluff. No consensus takes.

— Daniel Kaufman, Principal & CEO, Kaufman & Company